

Century 21 People’s Choice Realty Inc., Brokerage
120 MATHESON BLVD E #103
MISSISSAUGA, Ontario
L4Z 1X1


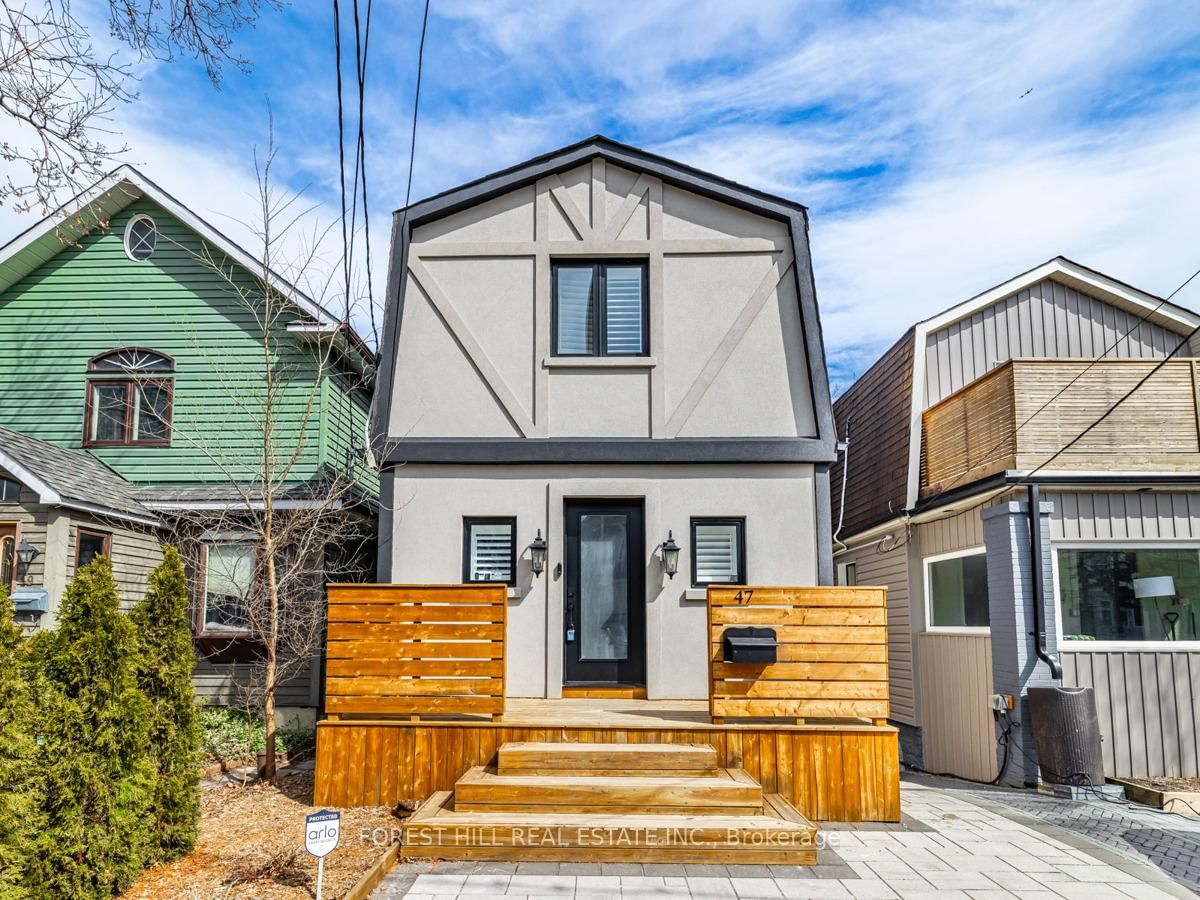
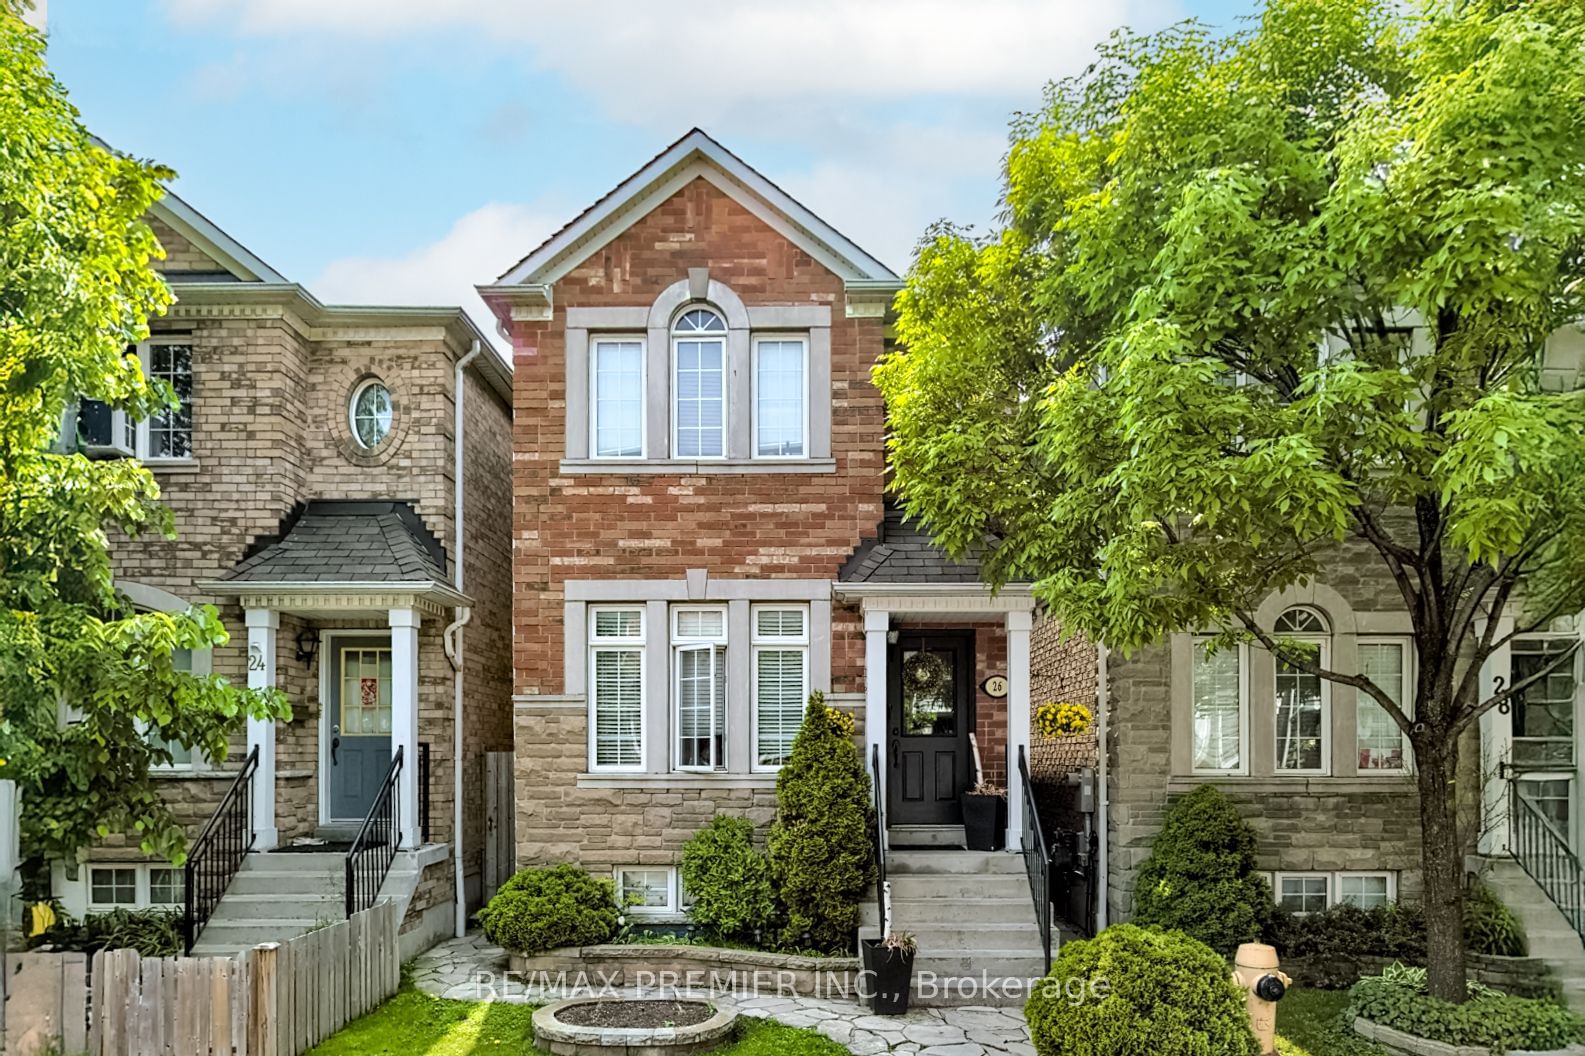
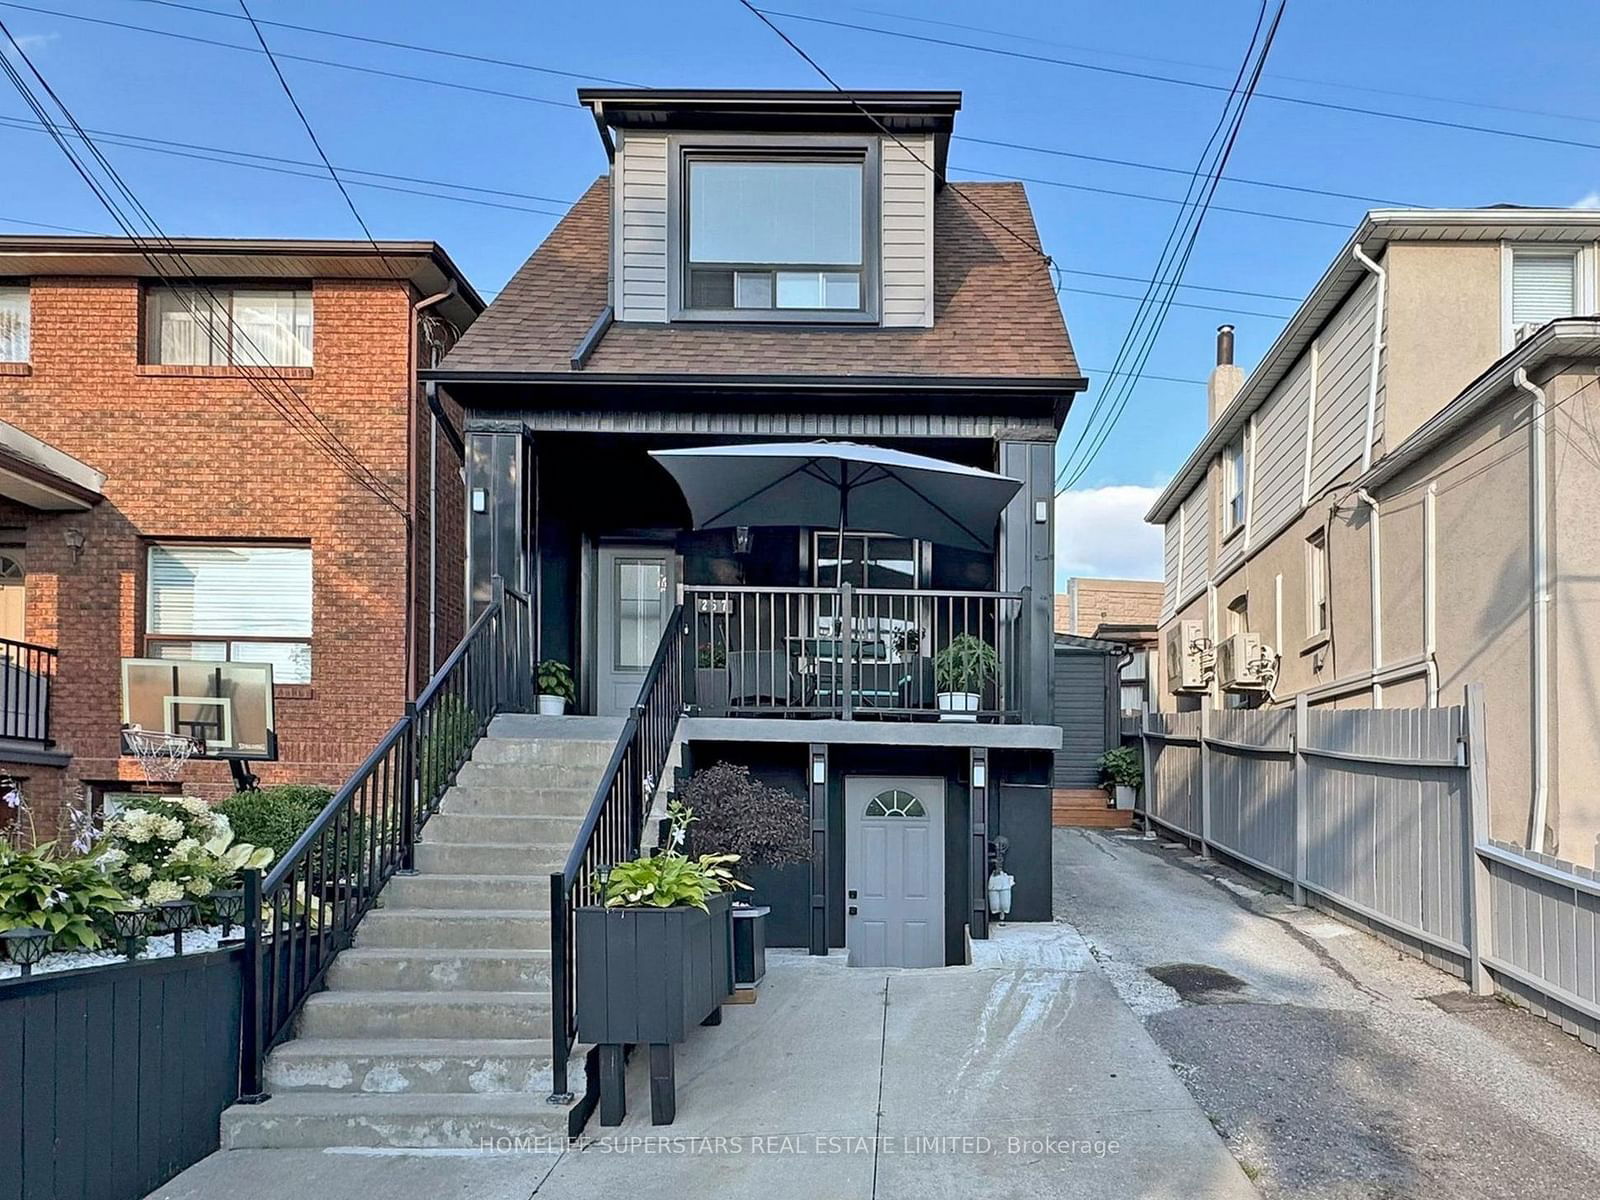
Toronto, Runnymede-Bloor West Village, M6S 2K8
$1,198,000
Listed by HARVEY KALLES REAL ESTATE LTD..
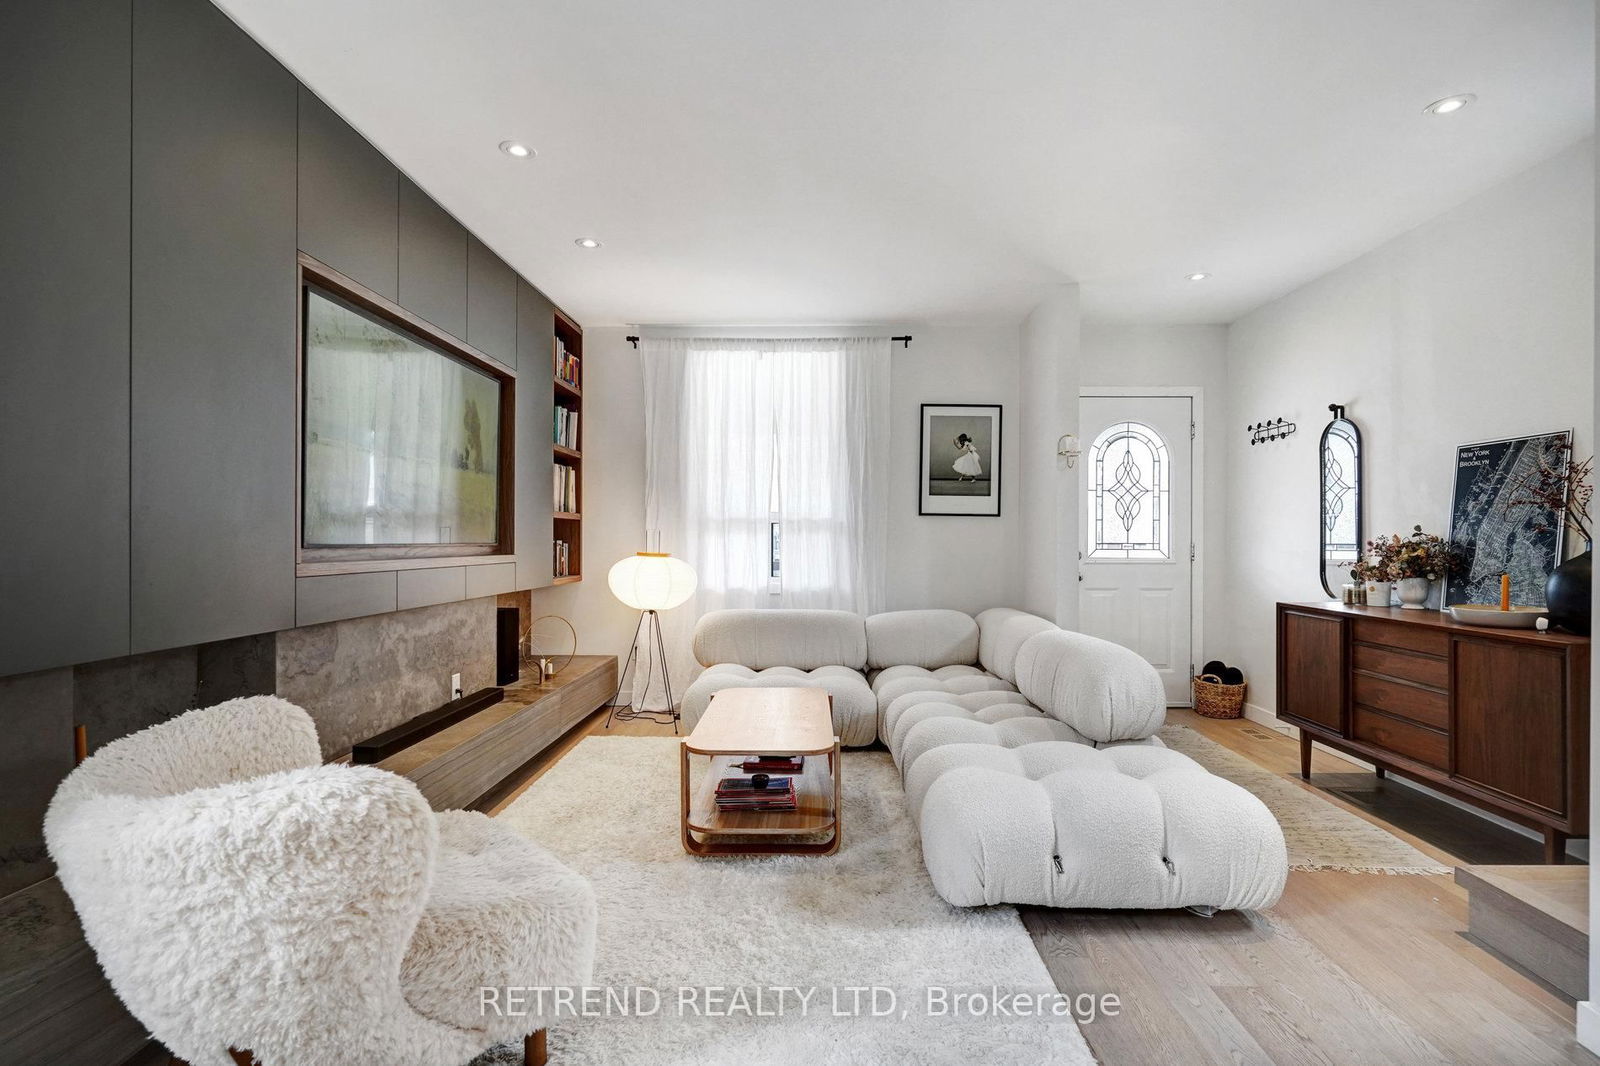
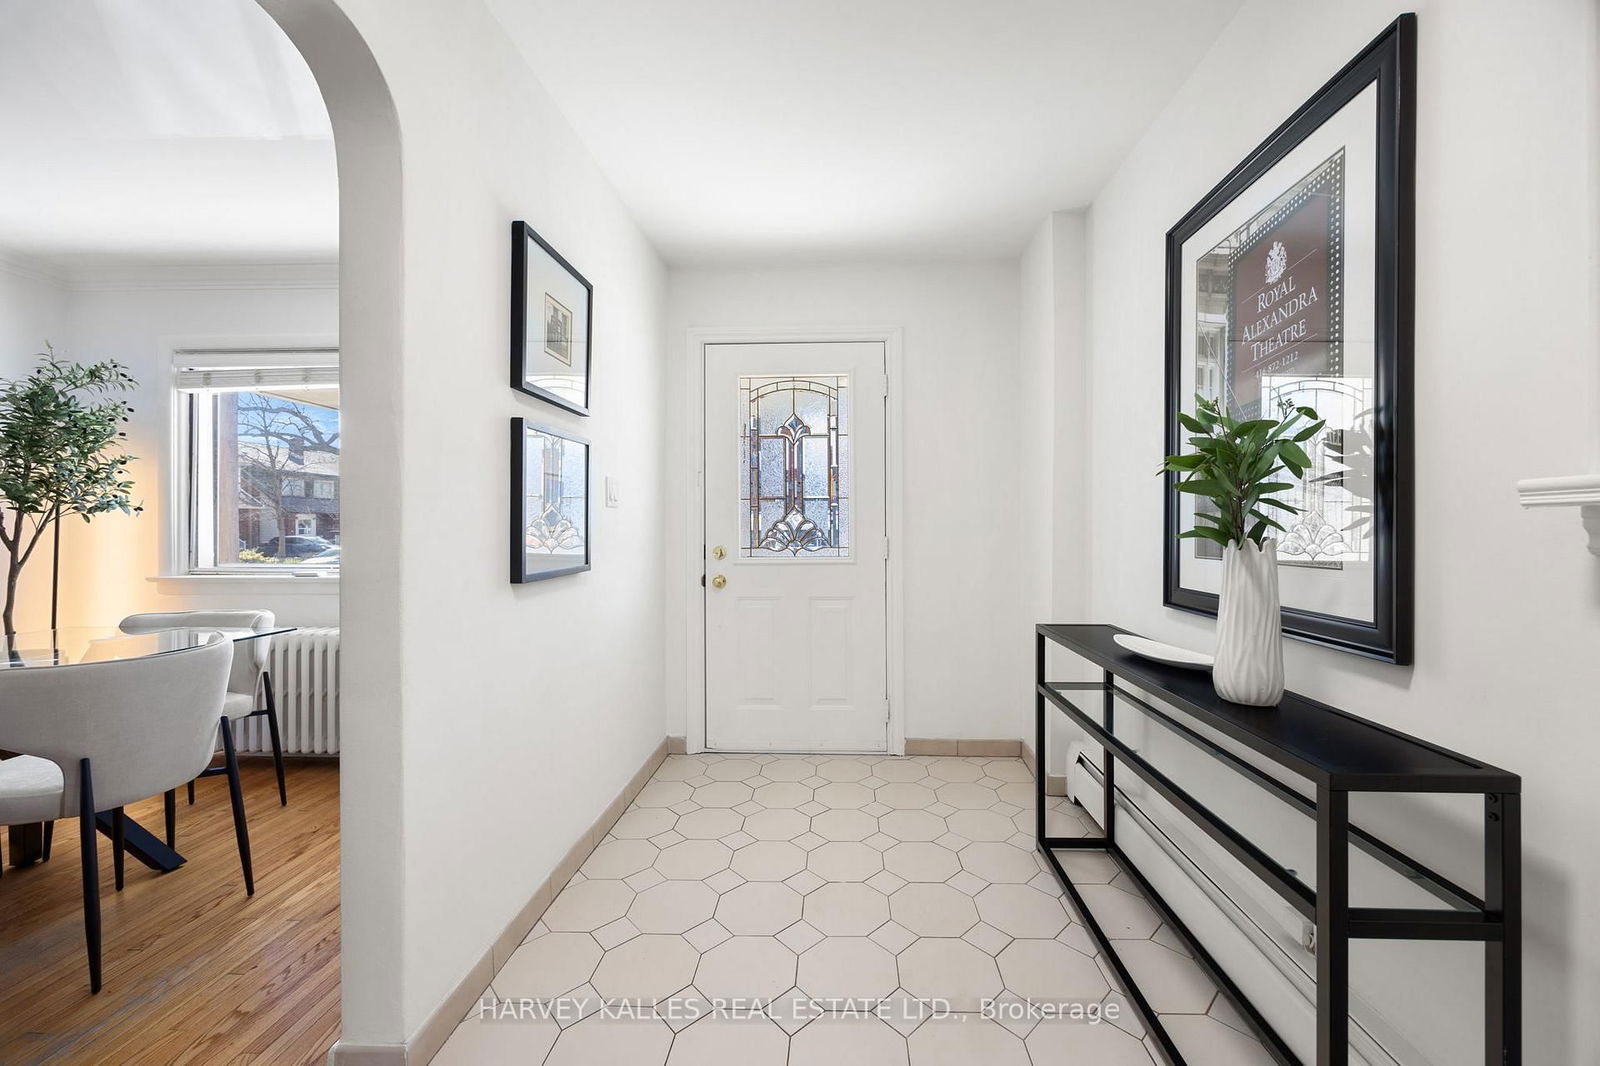
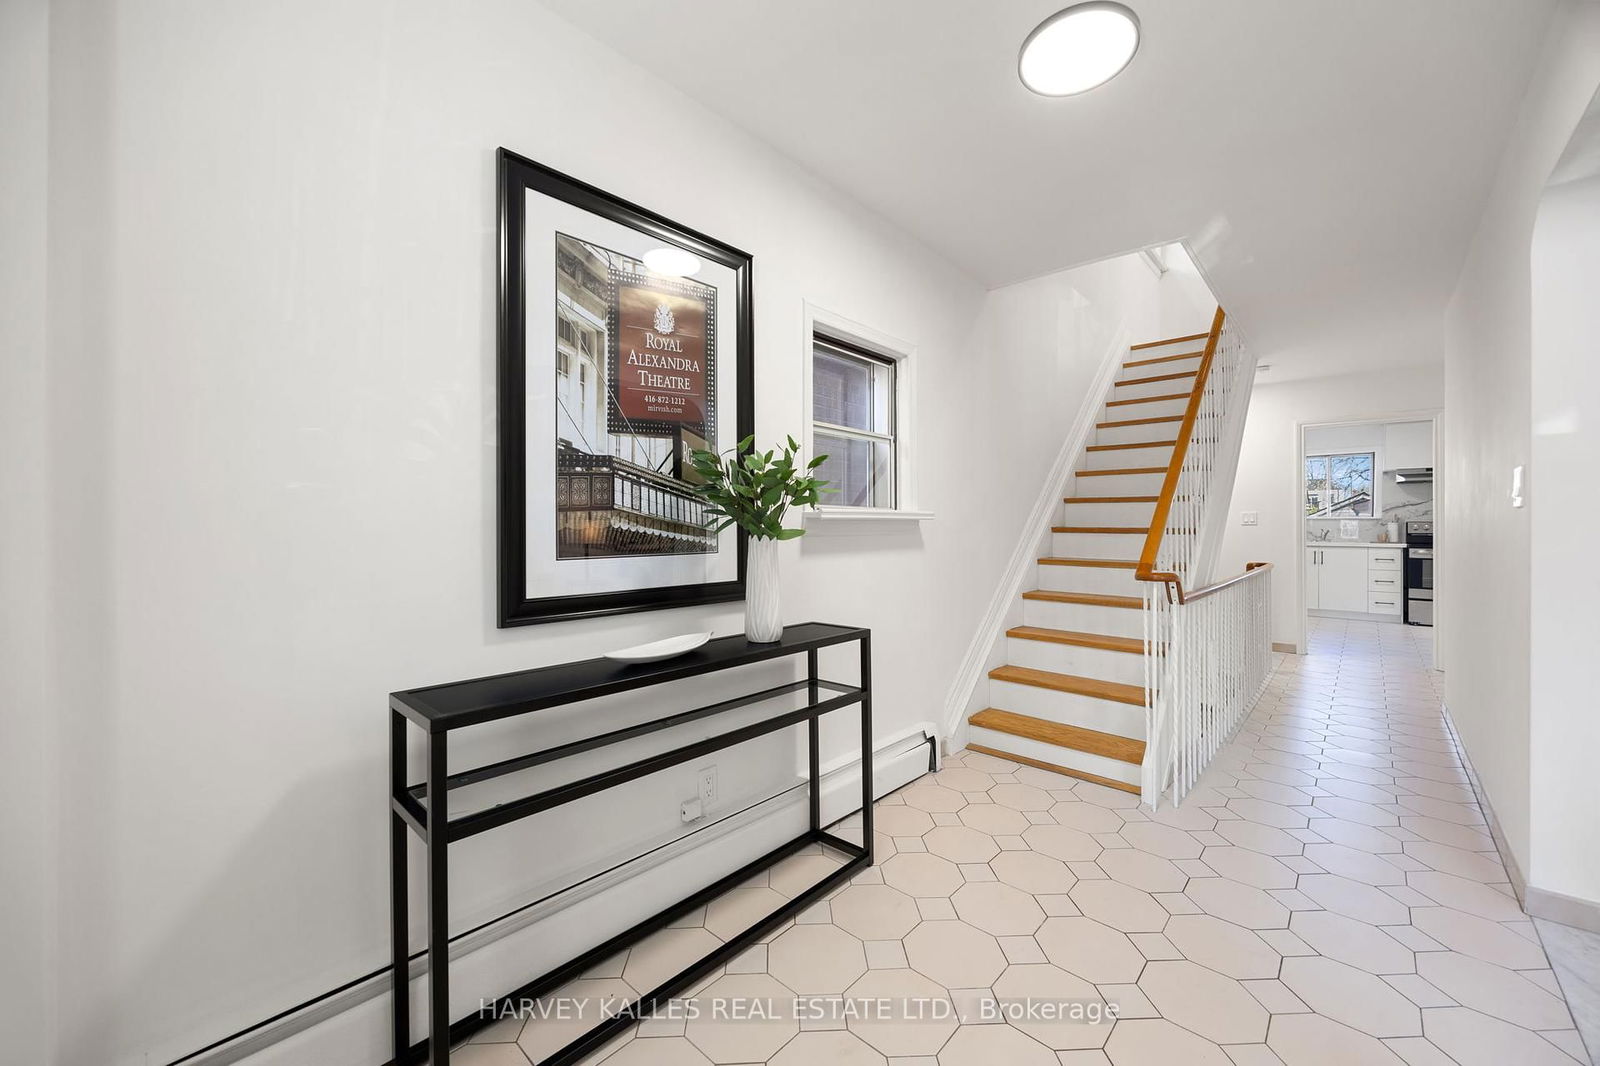
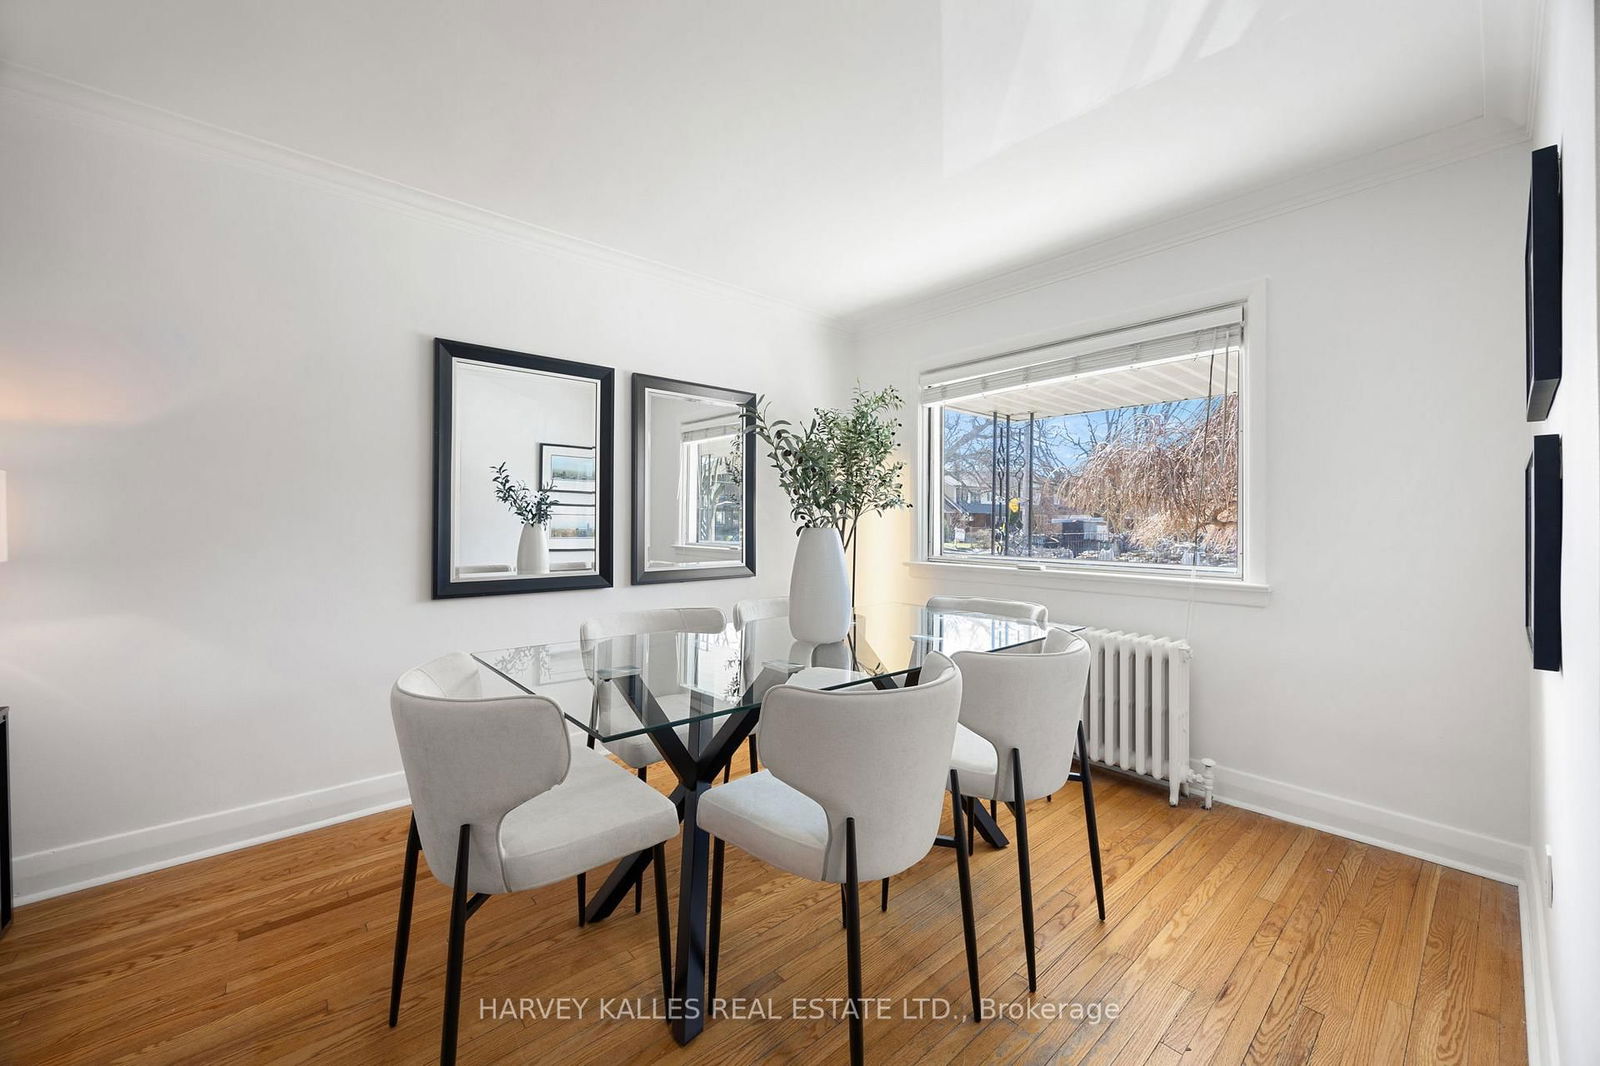
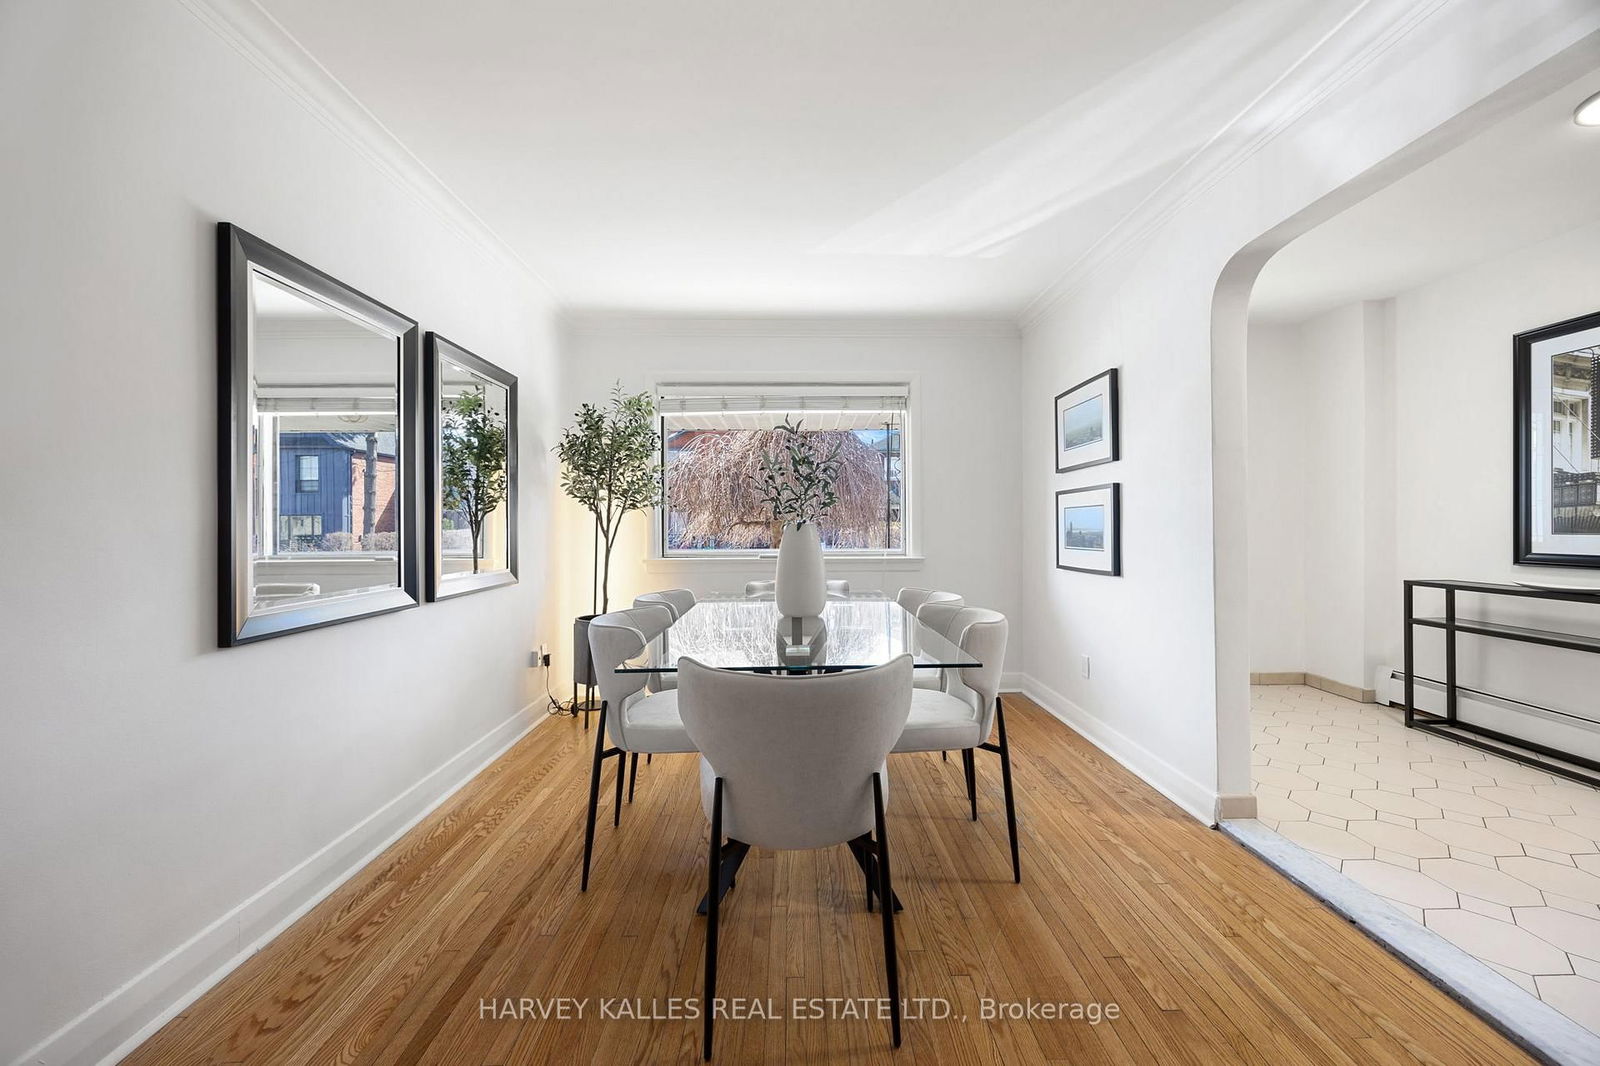
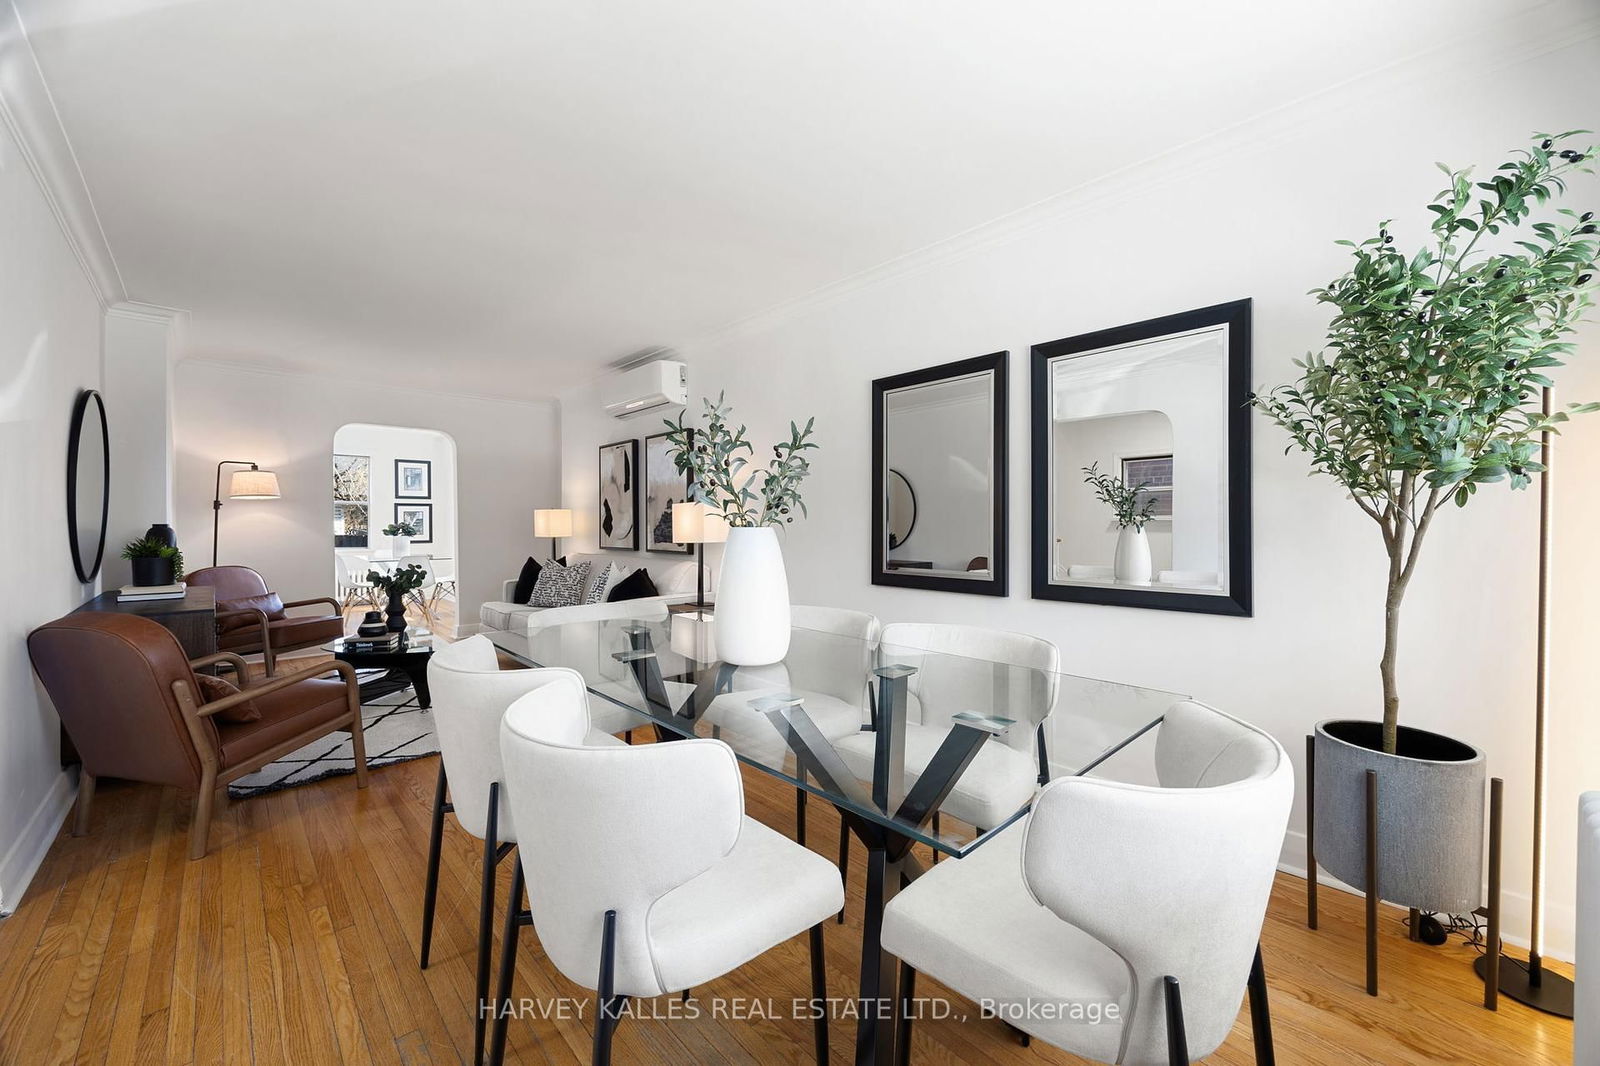
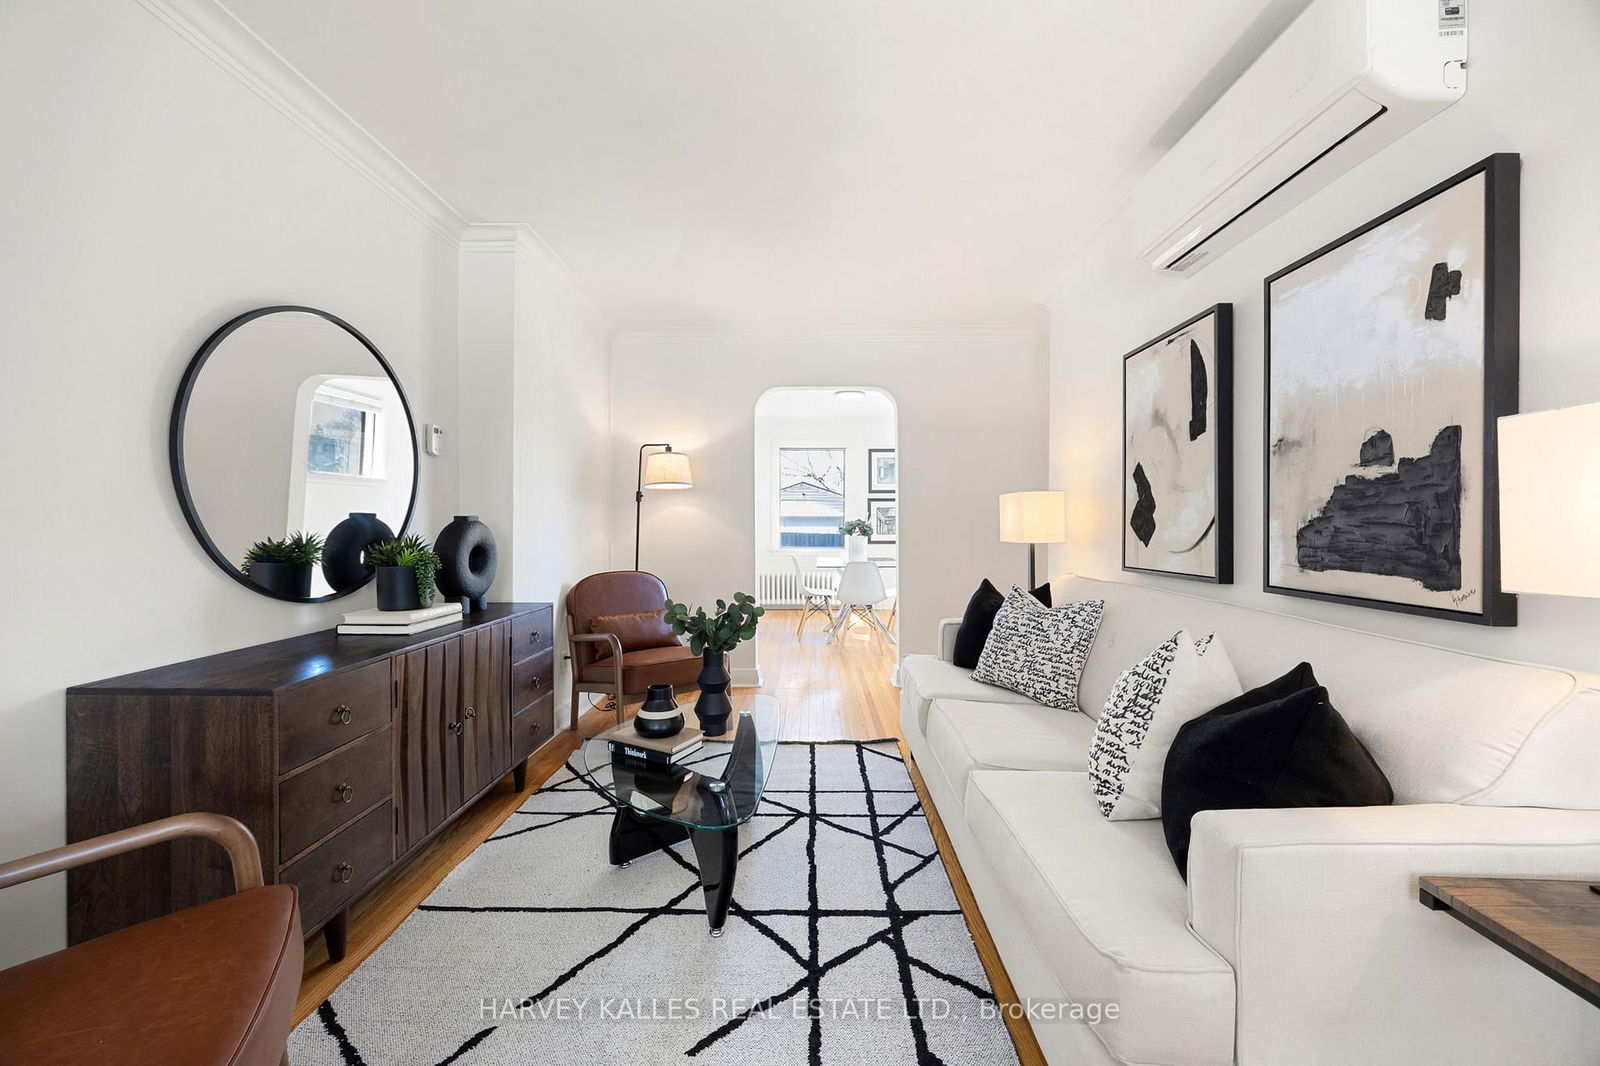
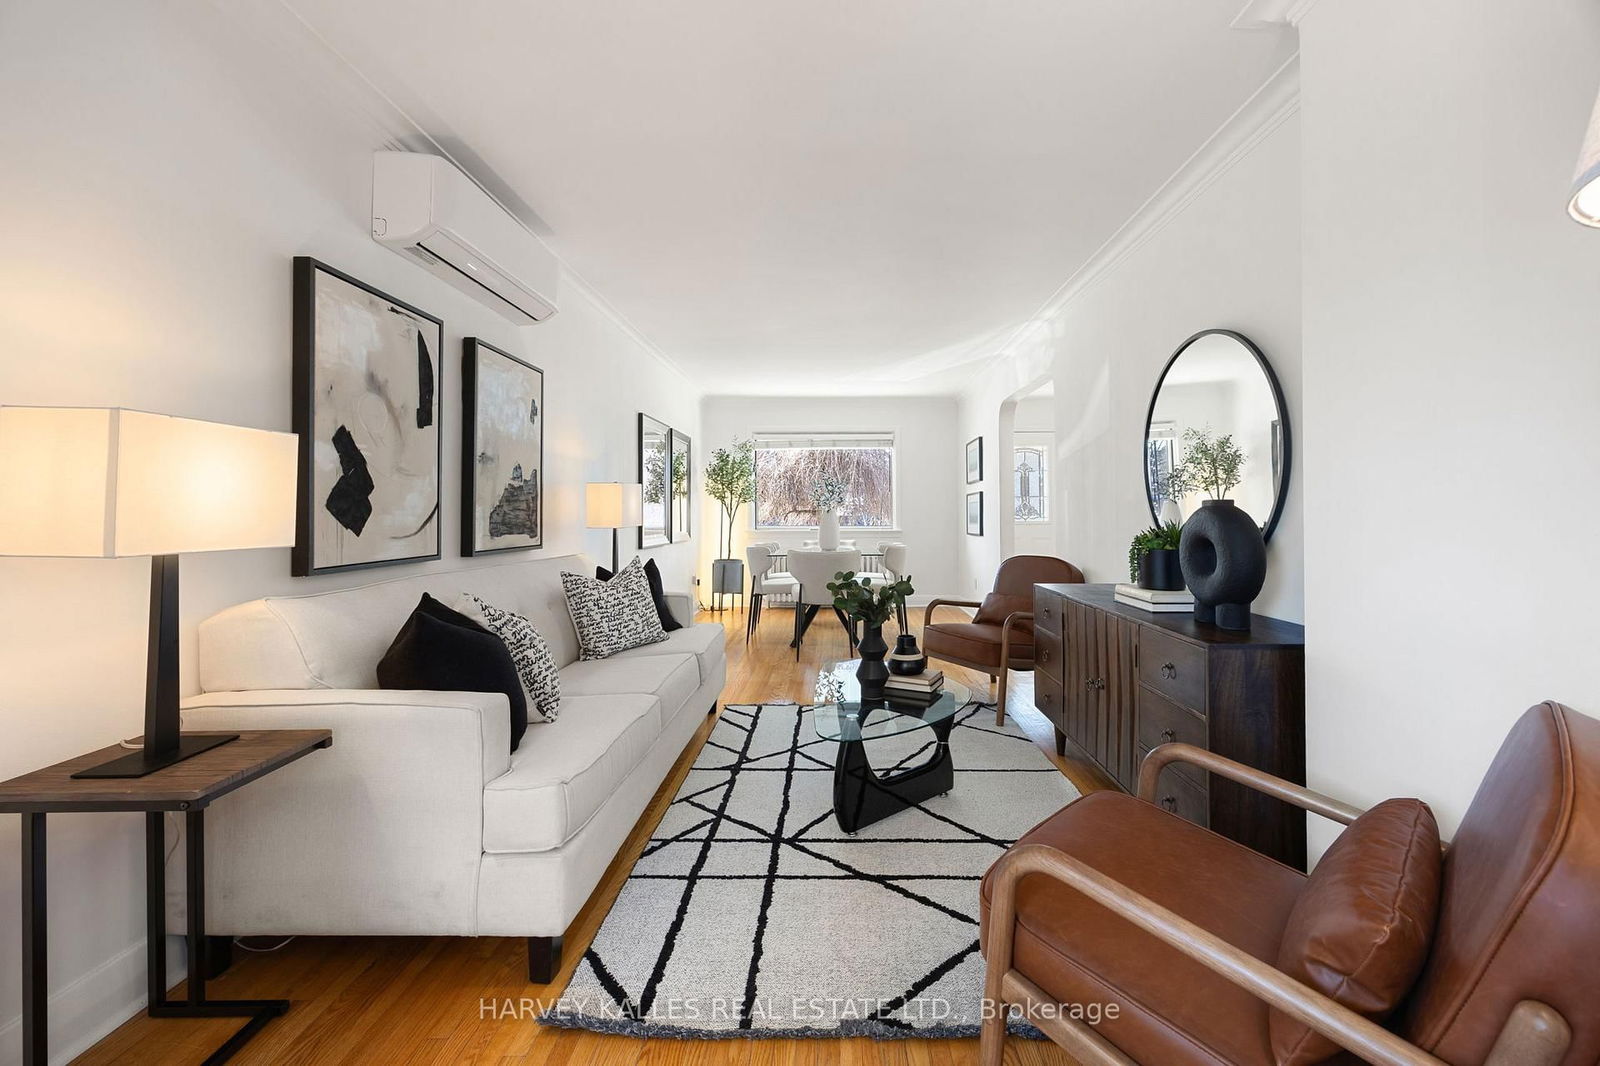
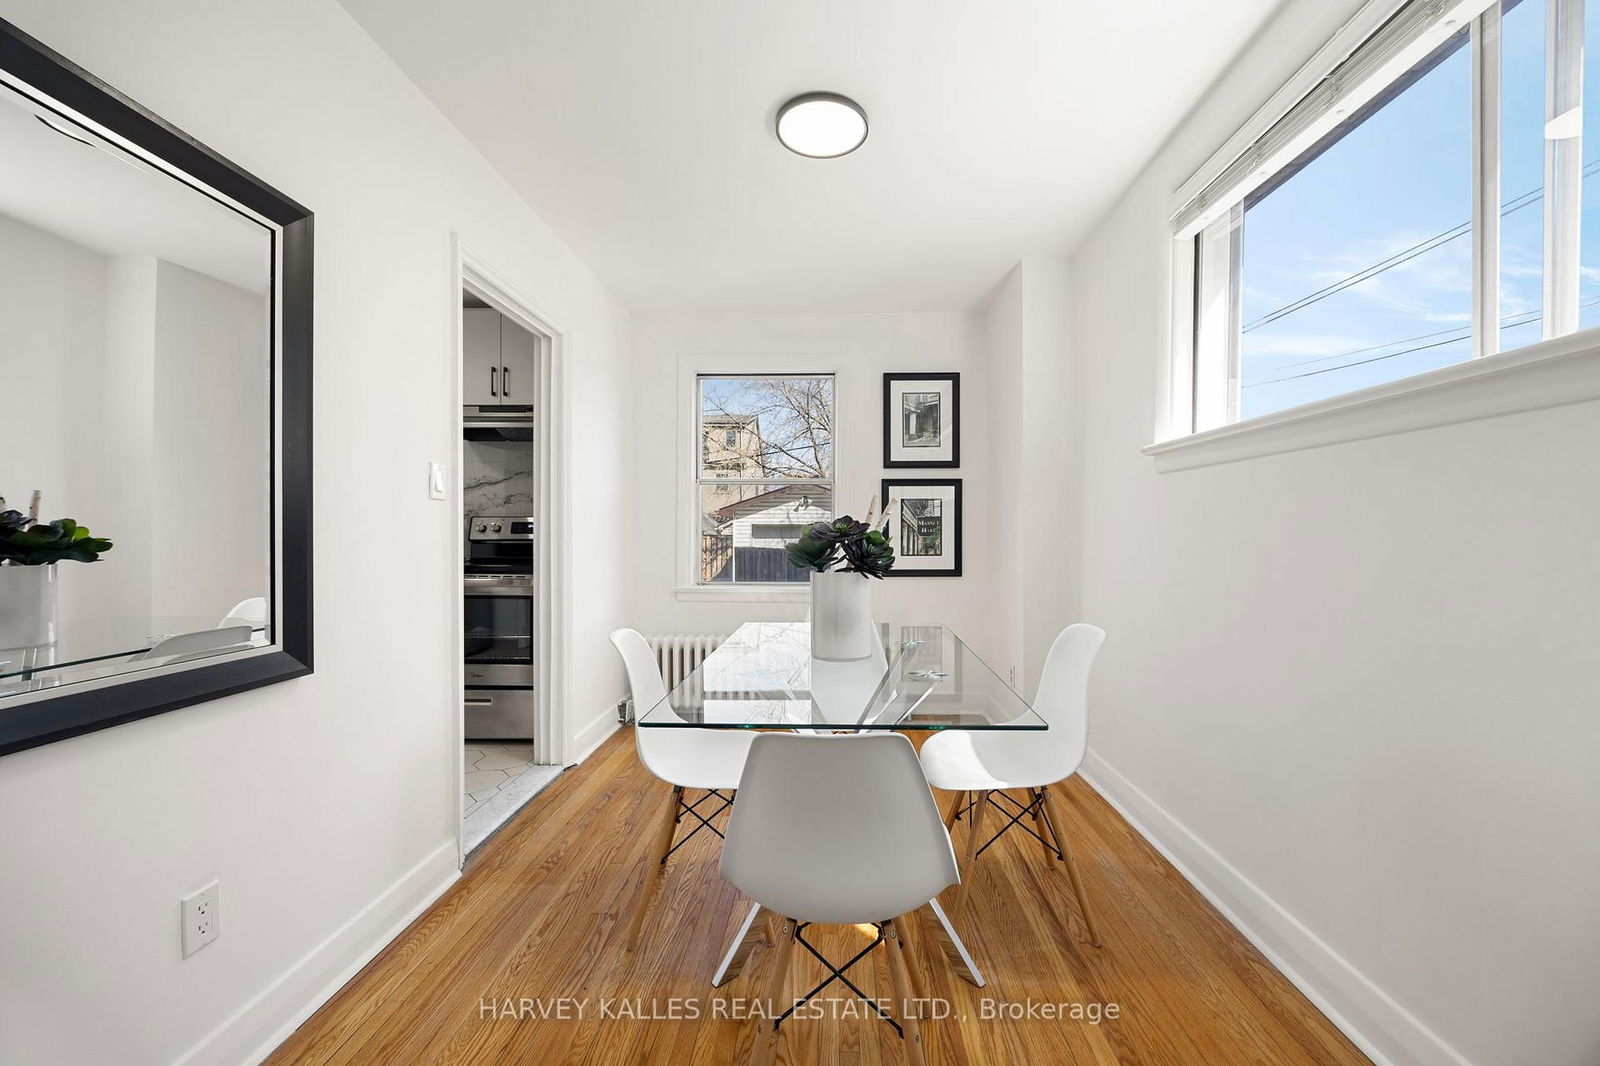
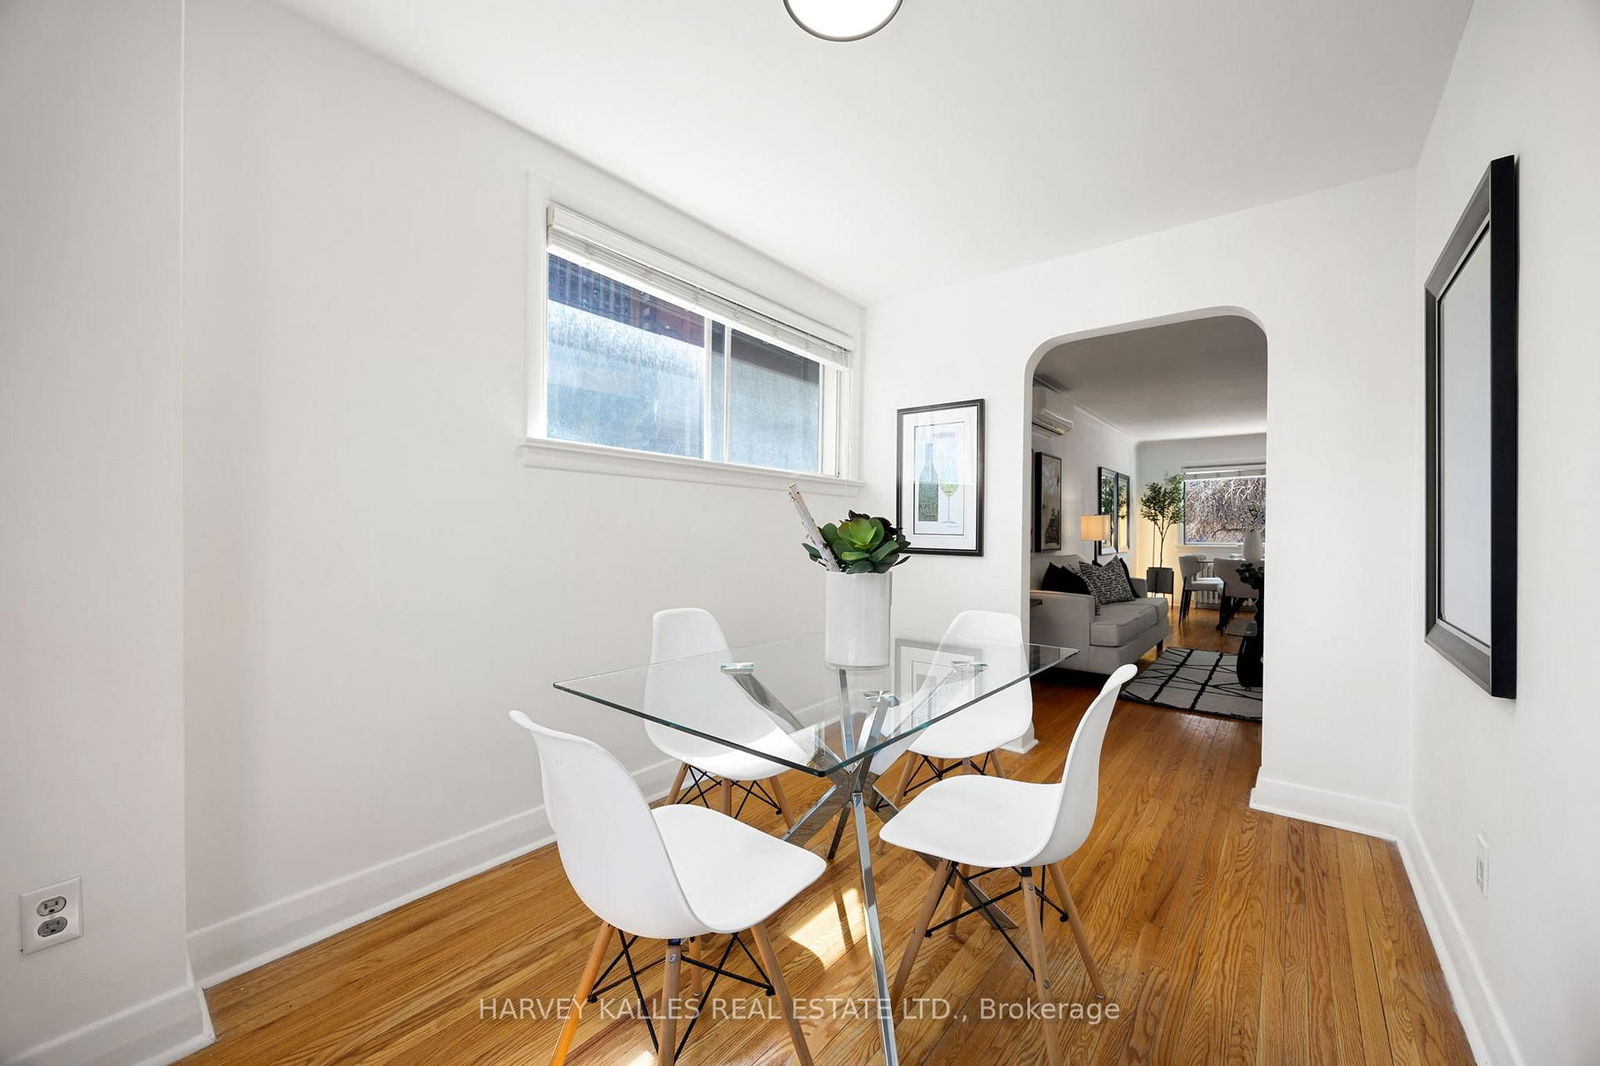
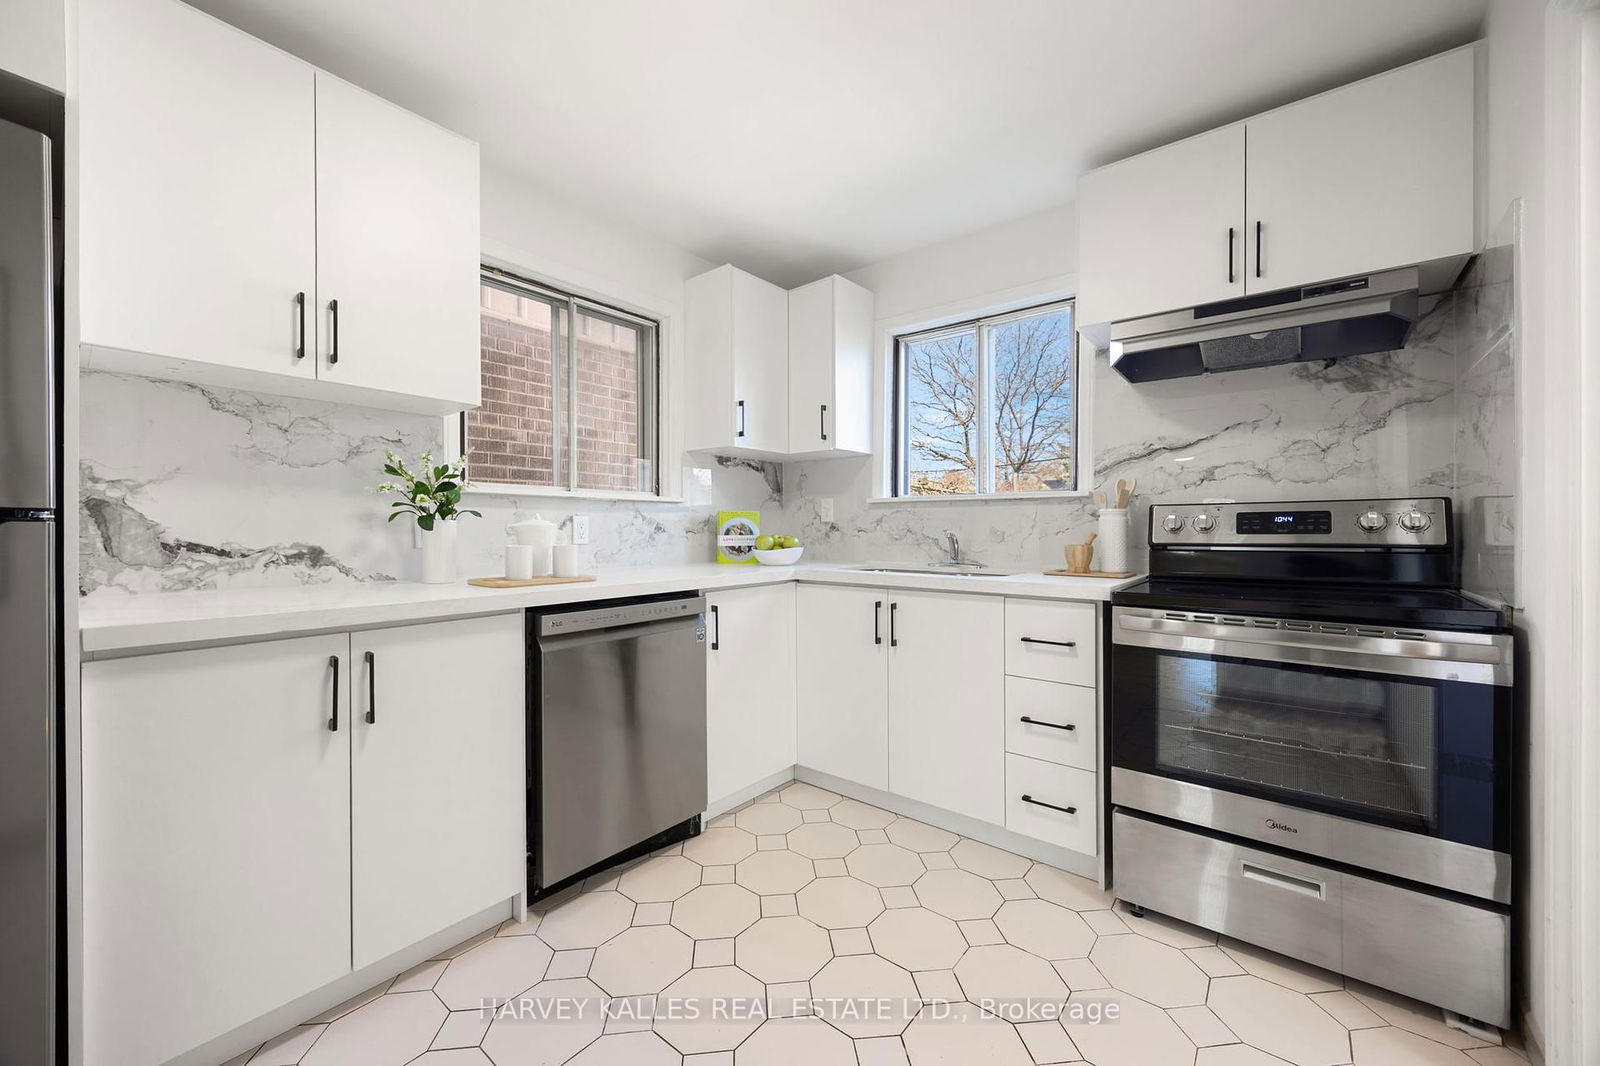
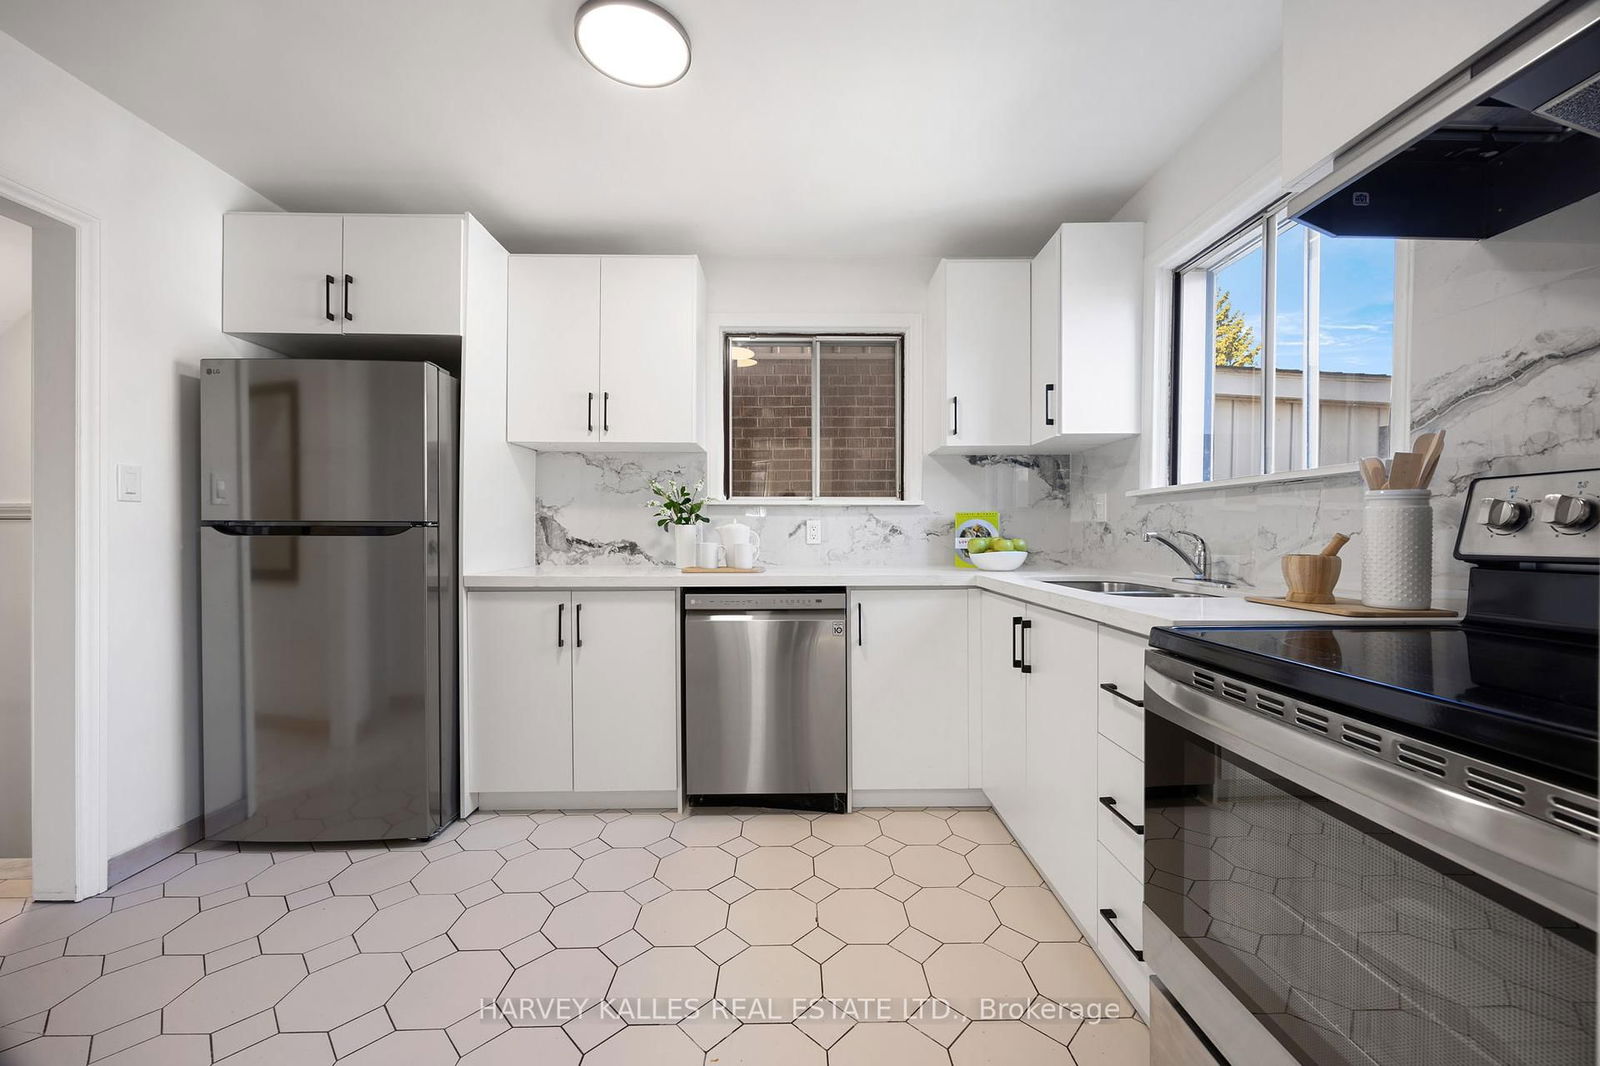
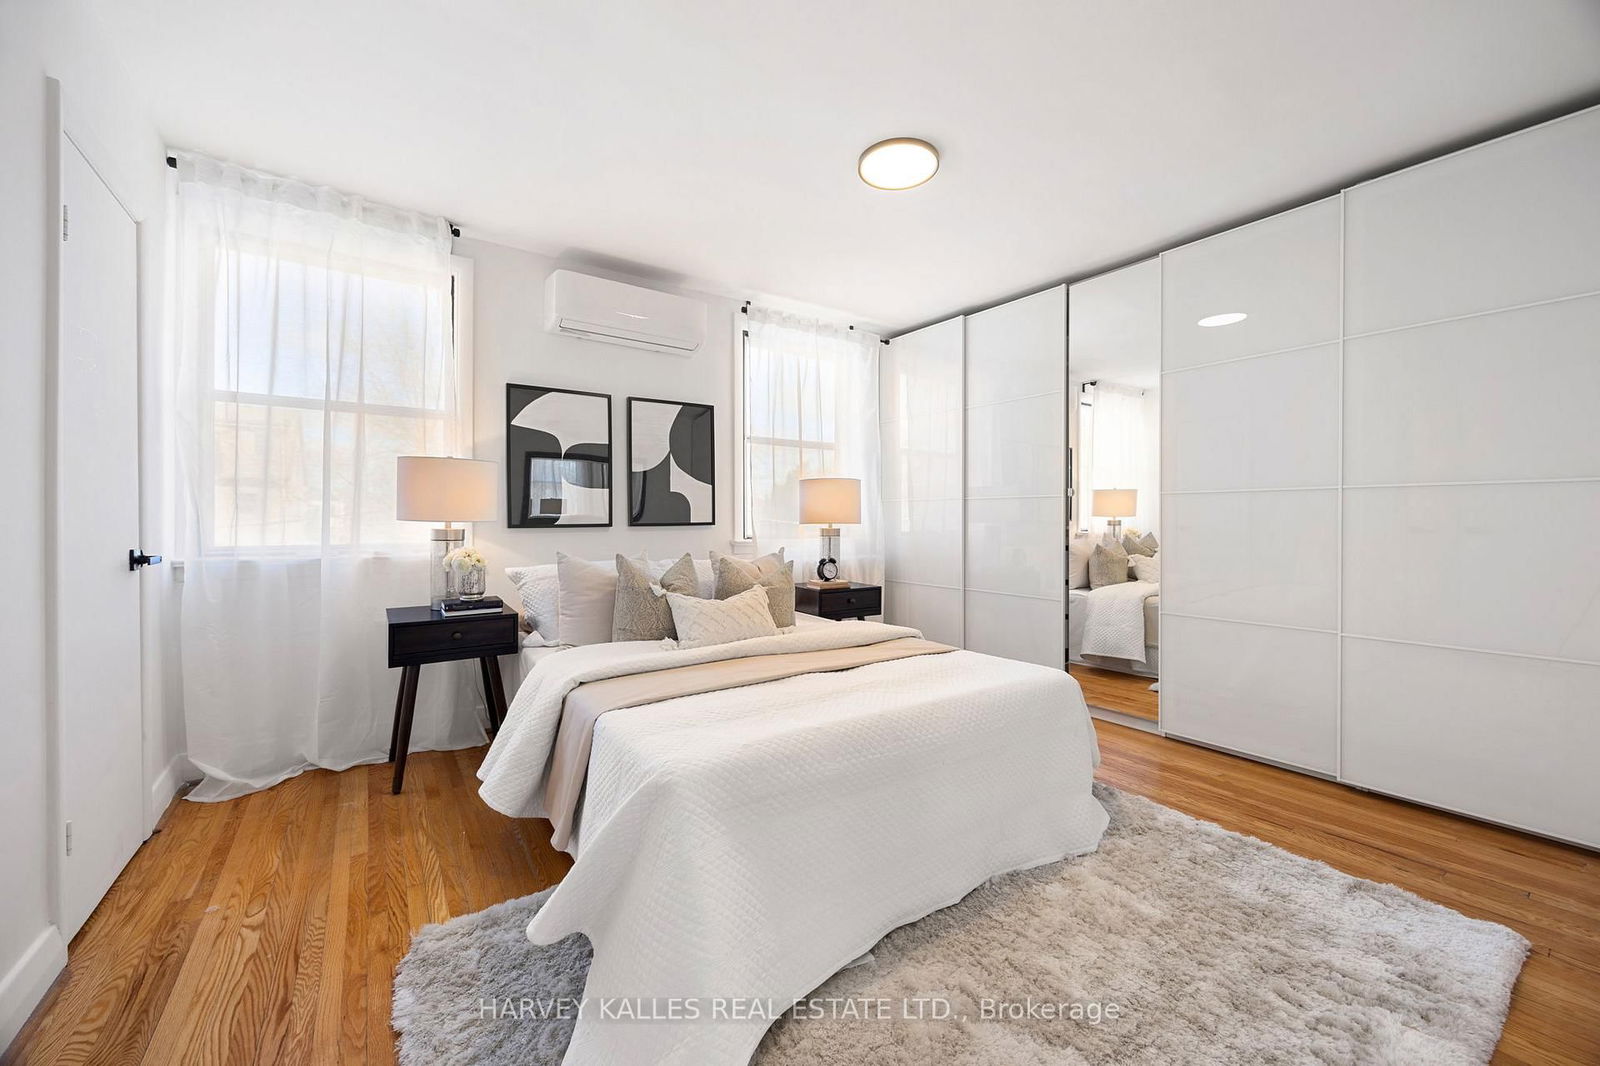
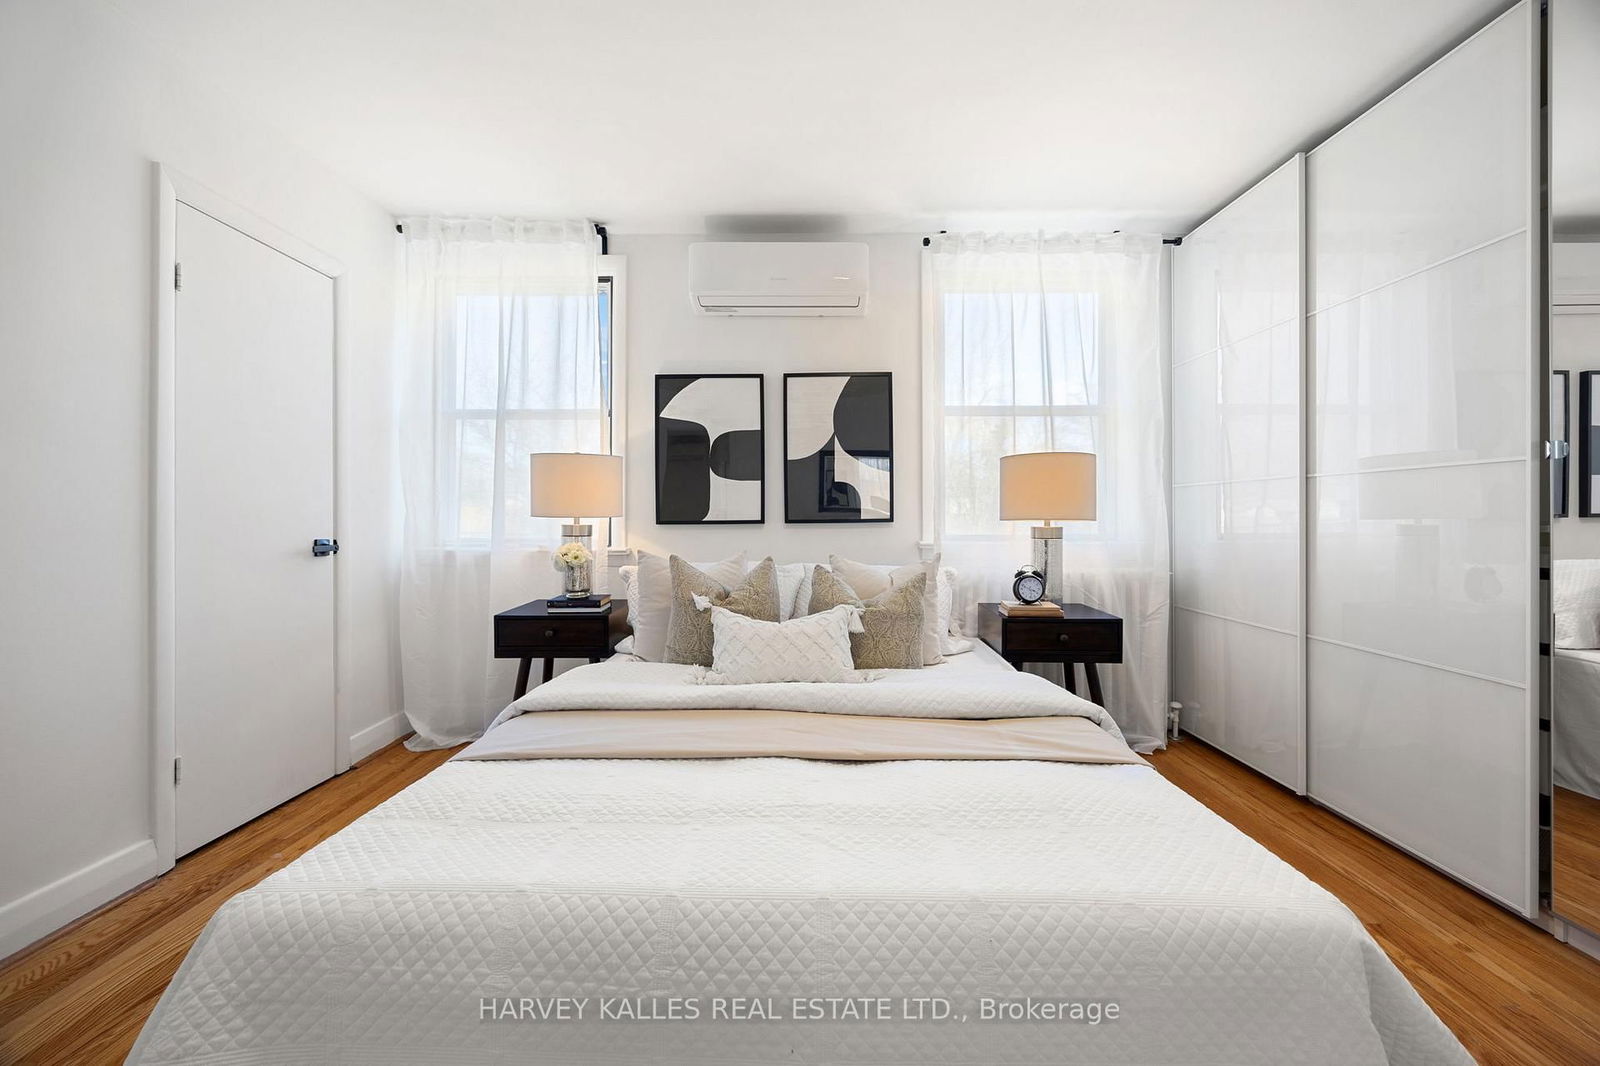
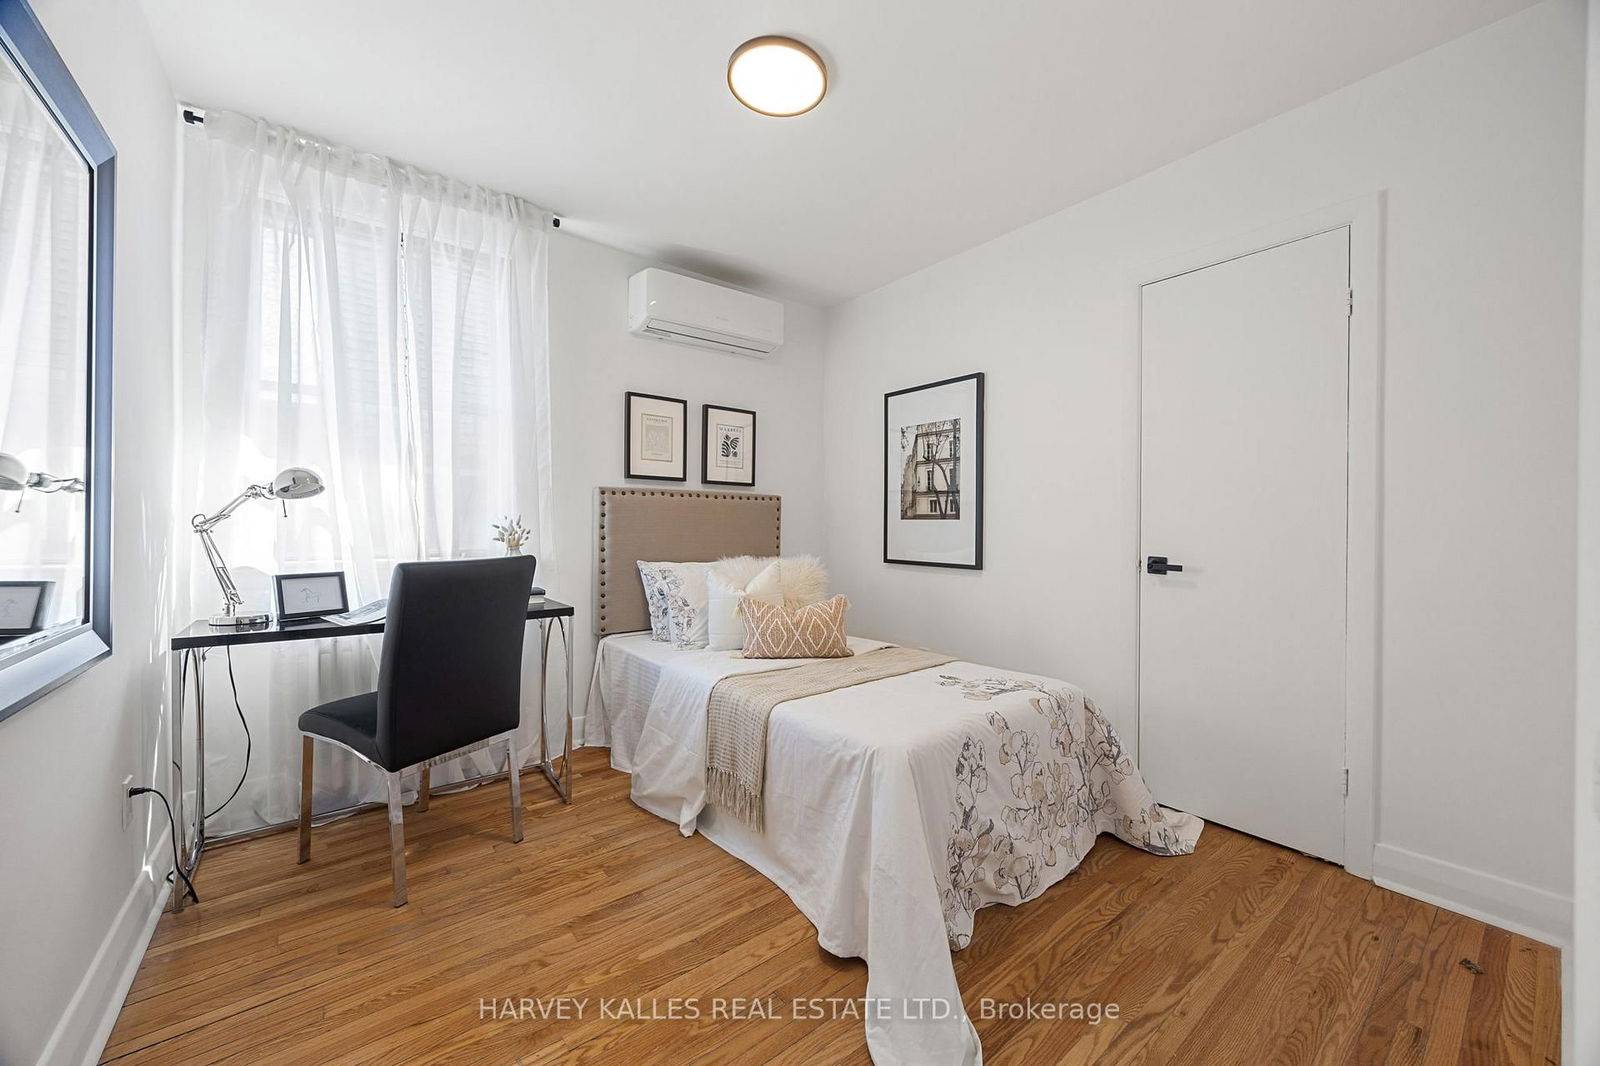
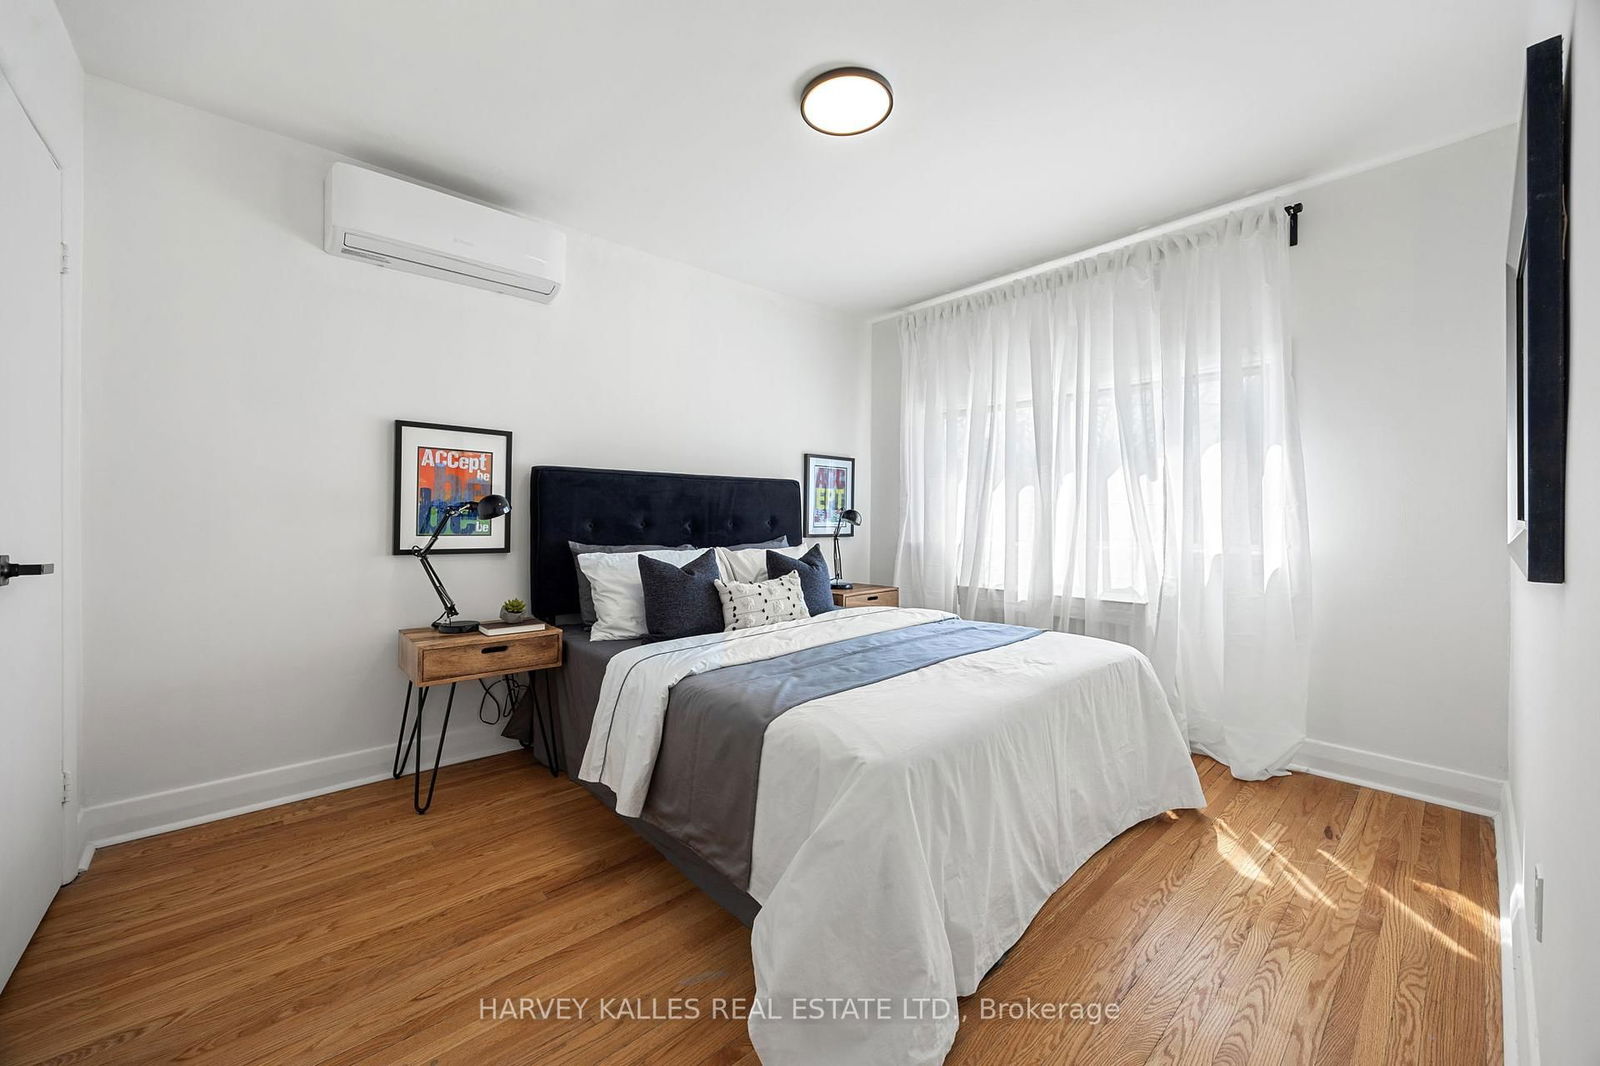
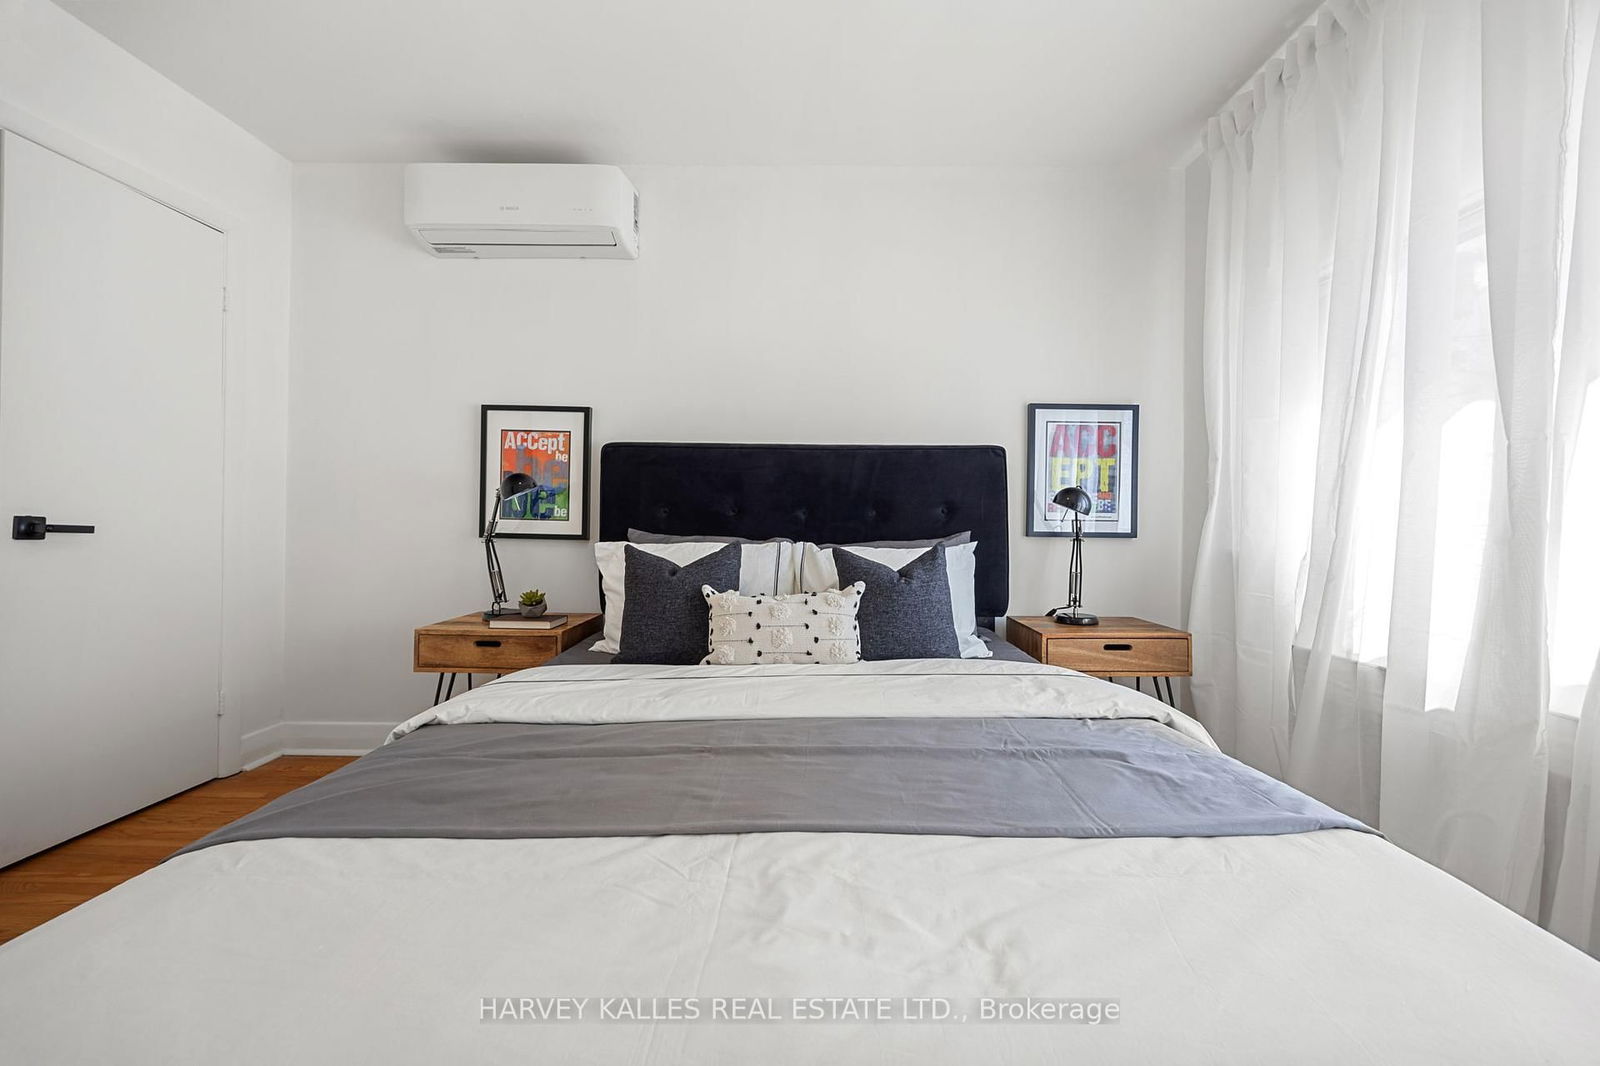
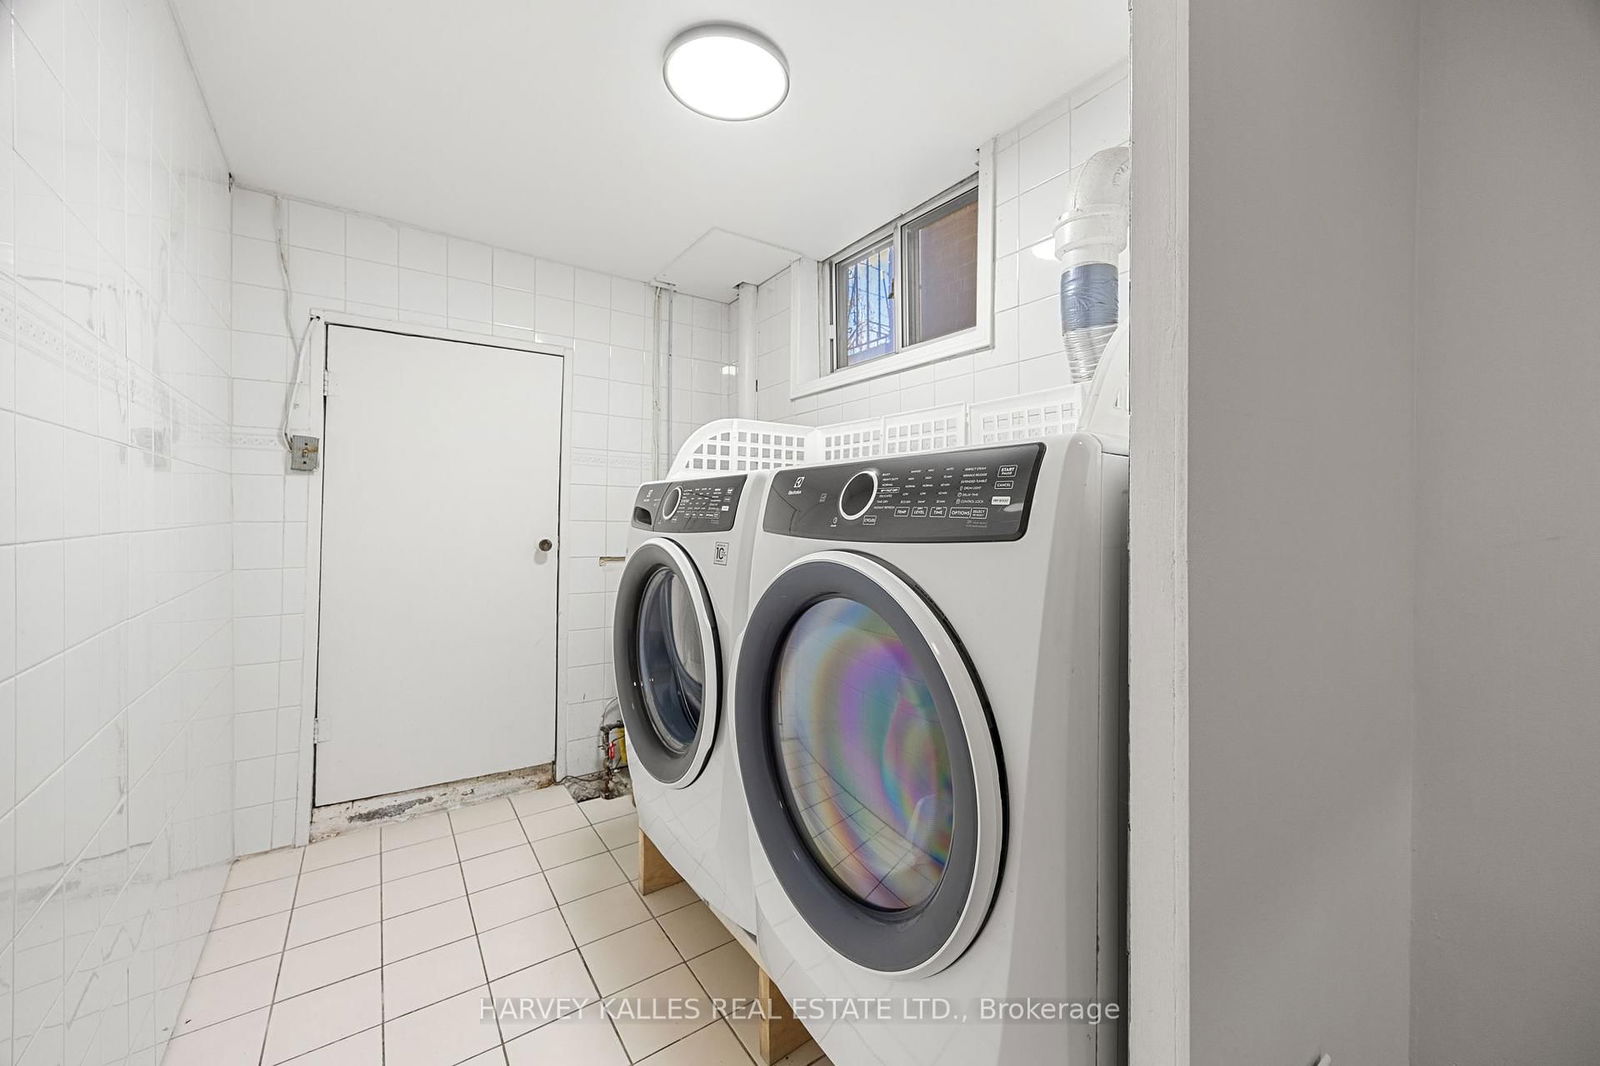
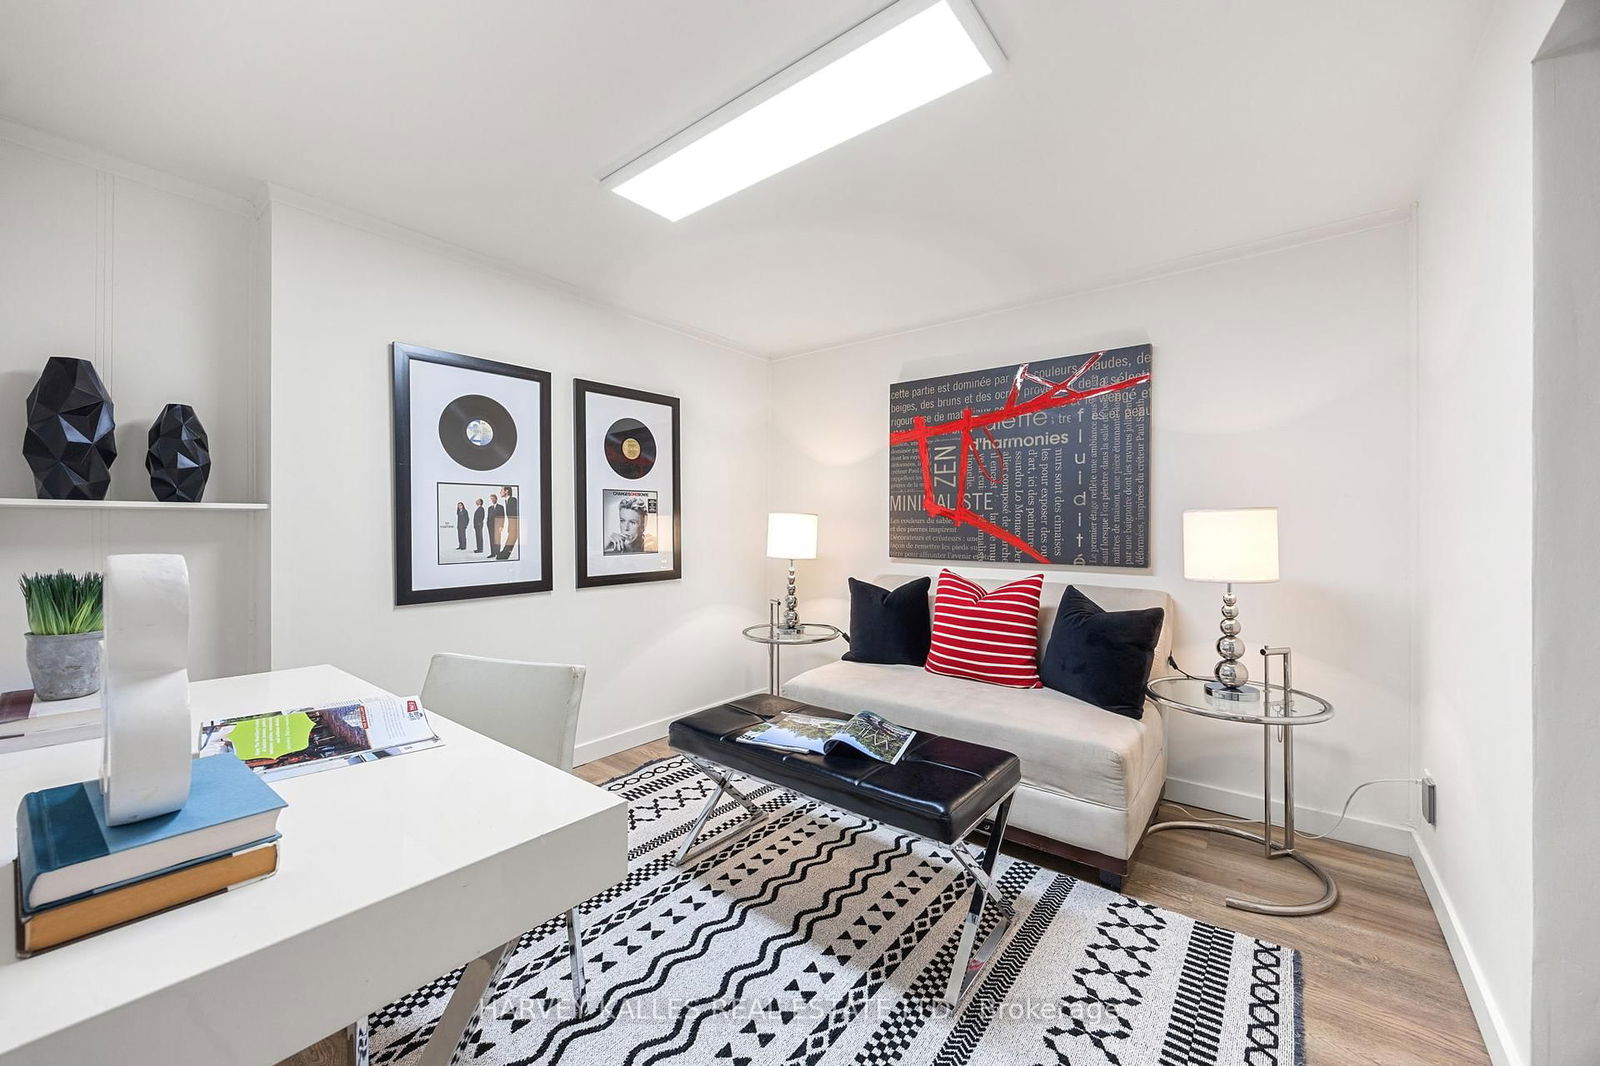
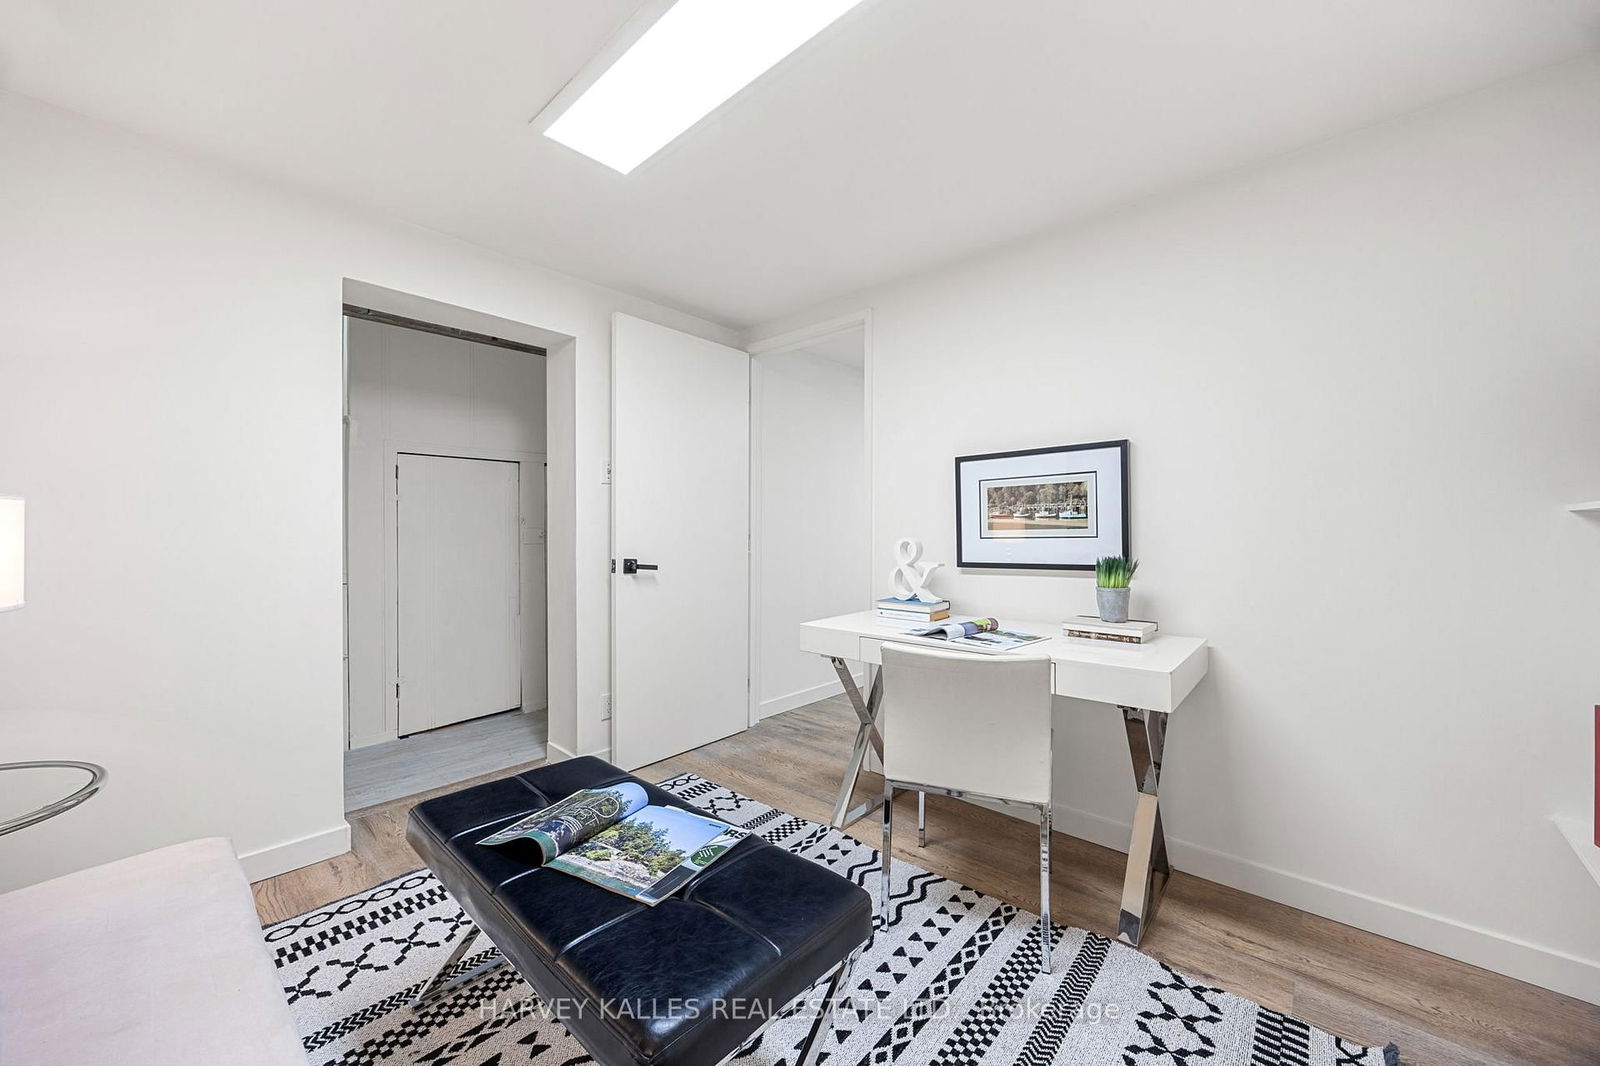
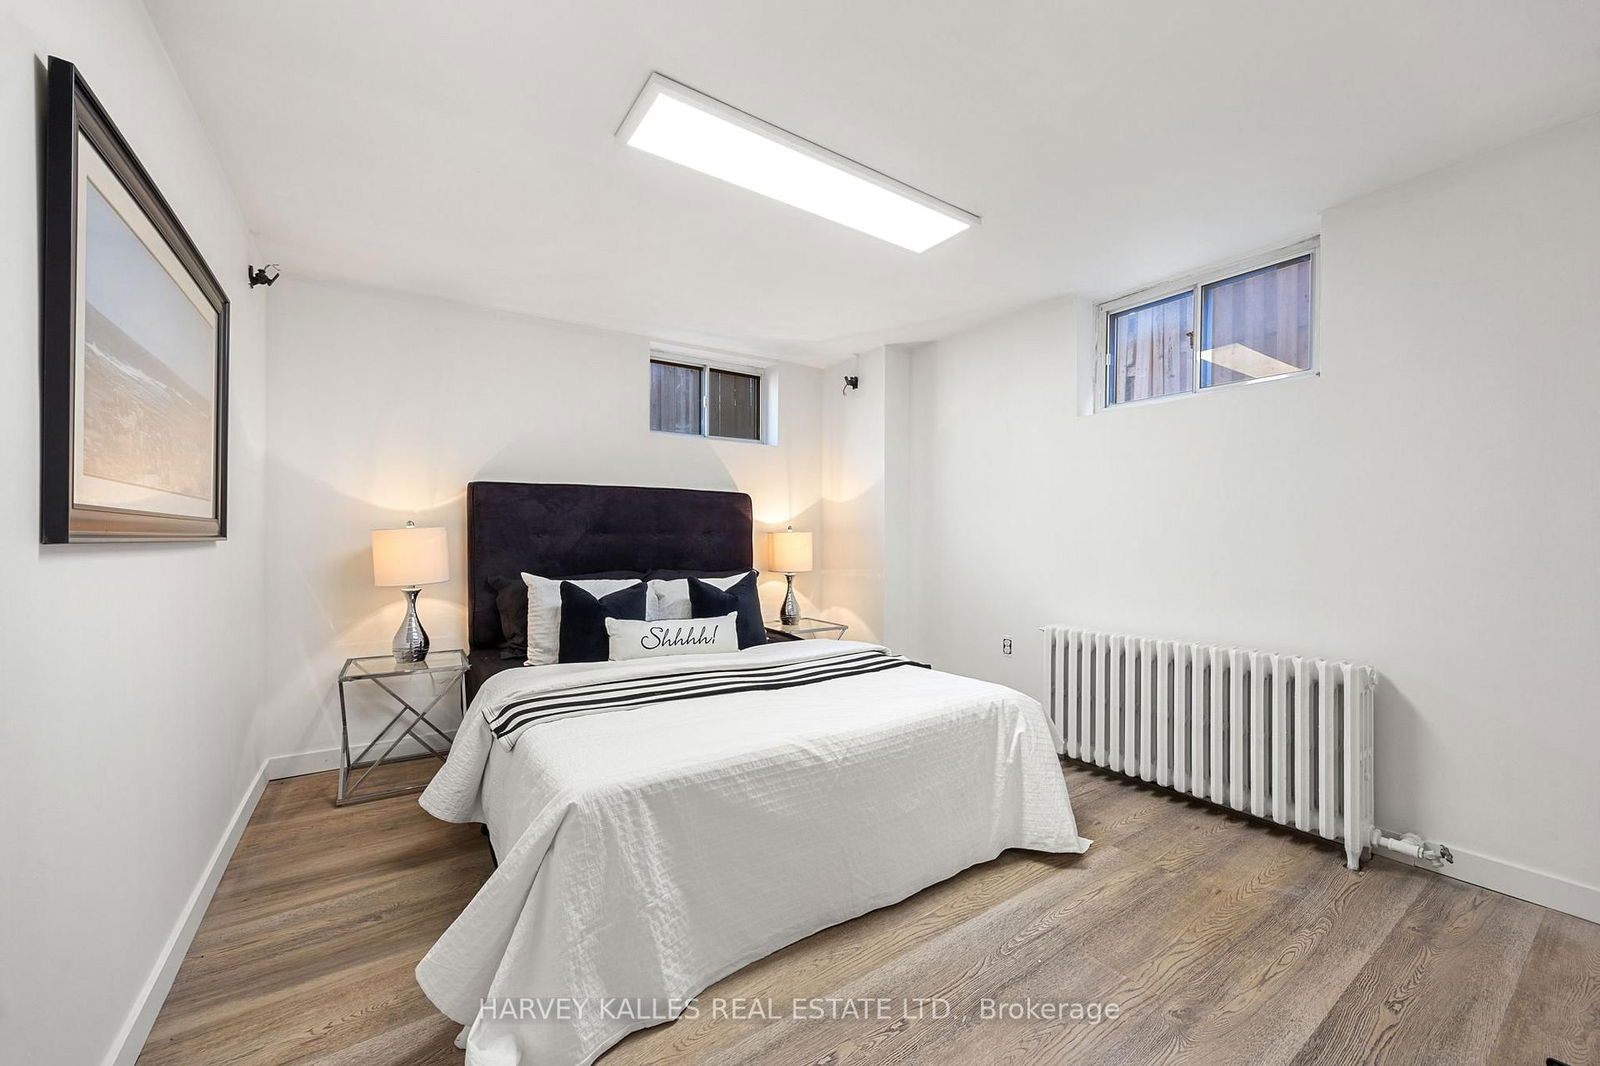
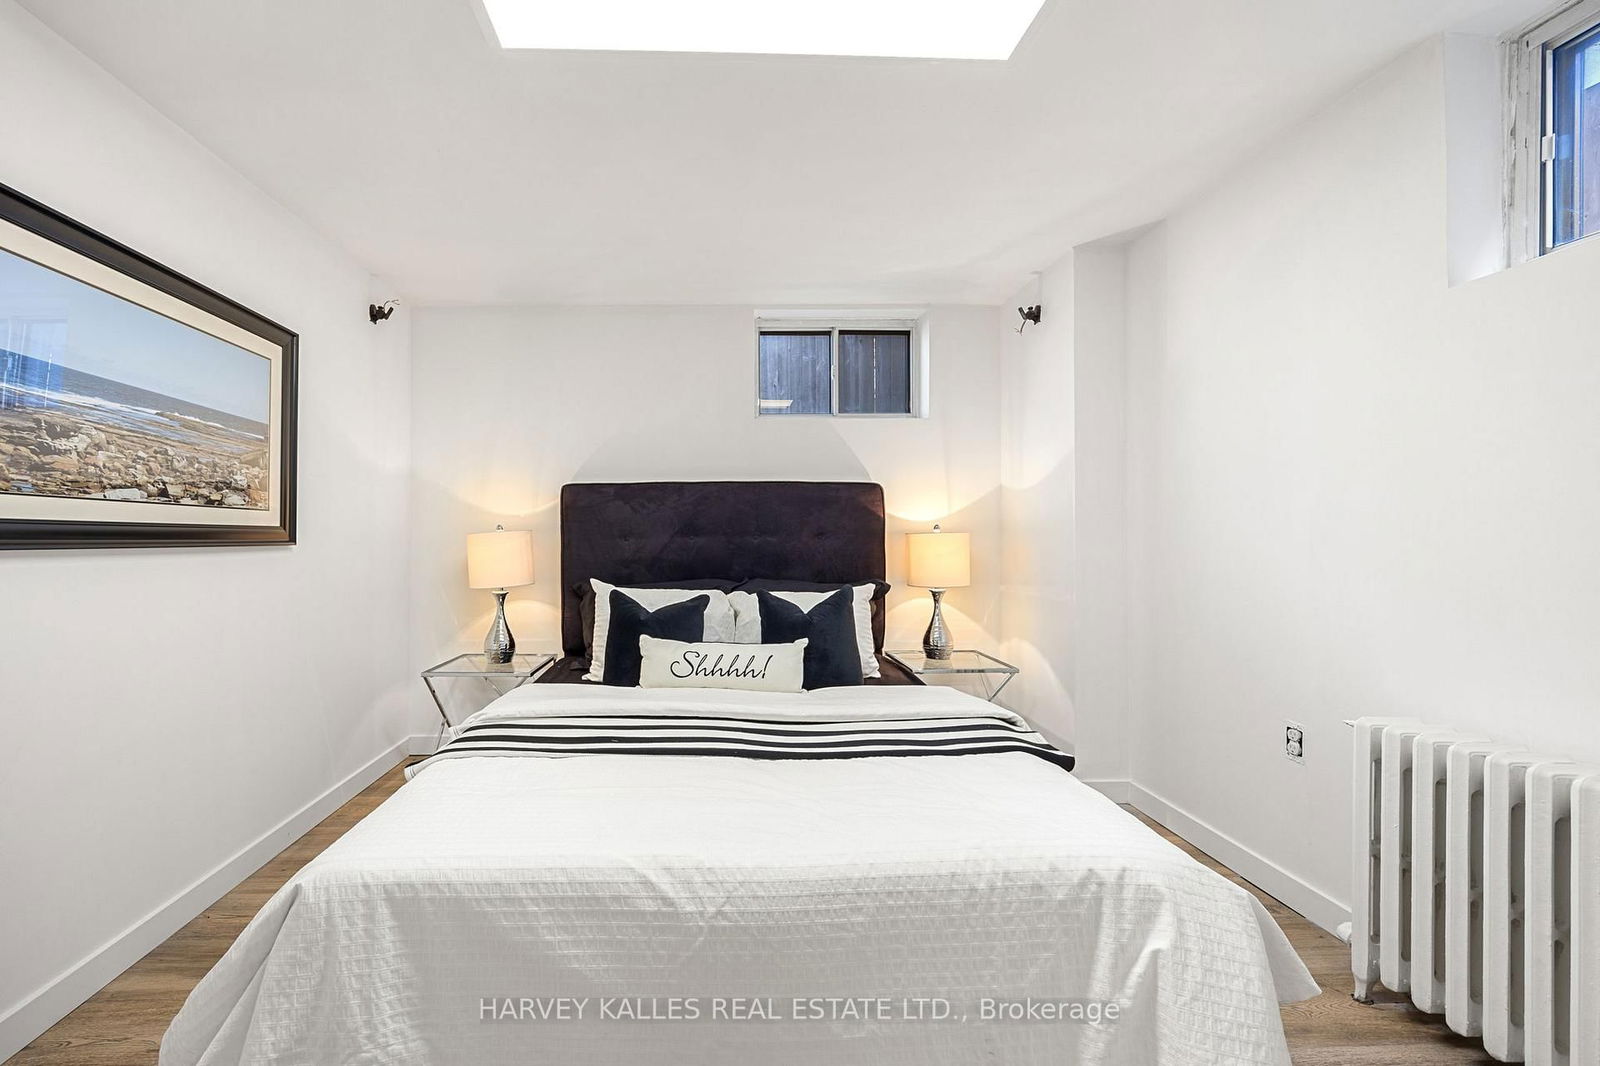
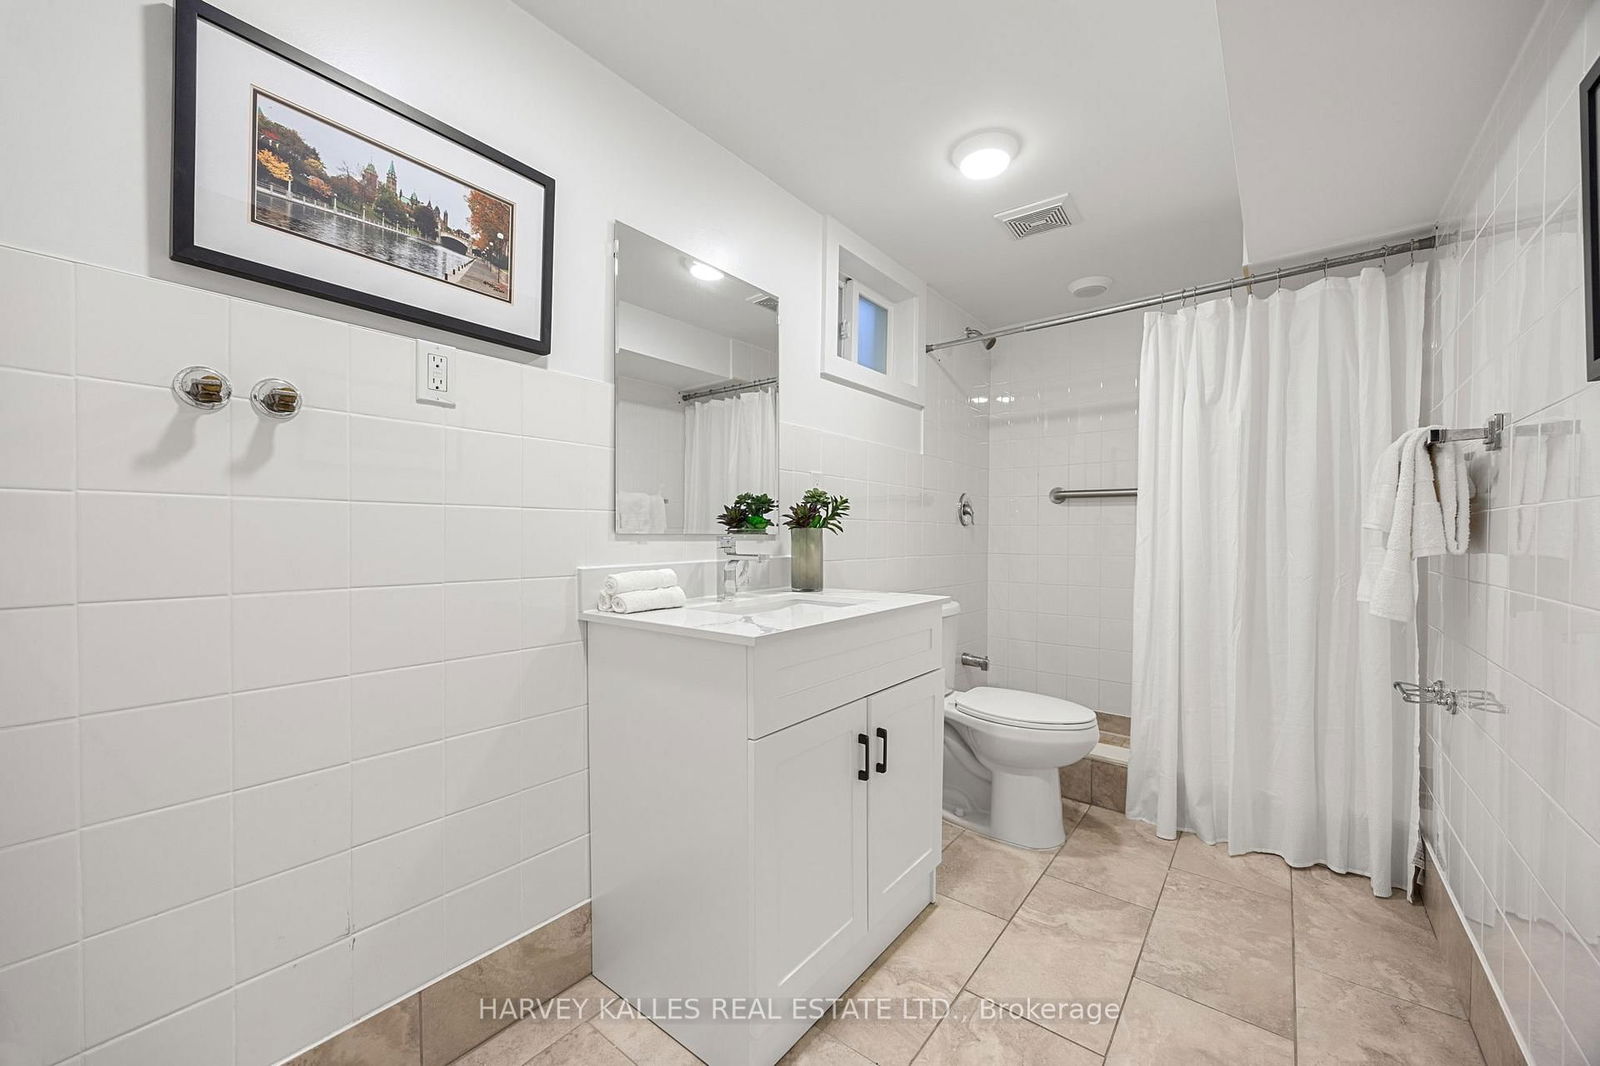
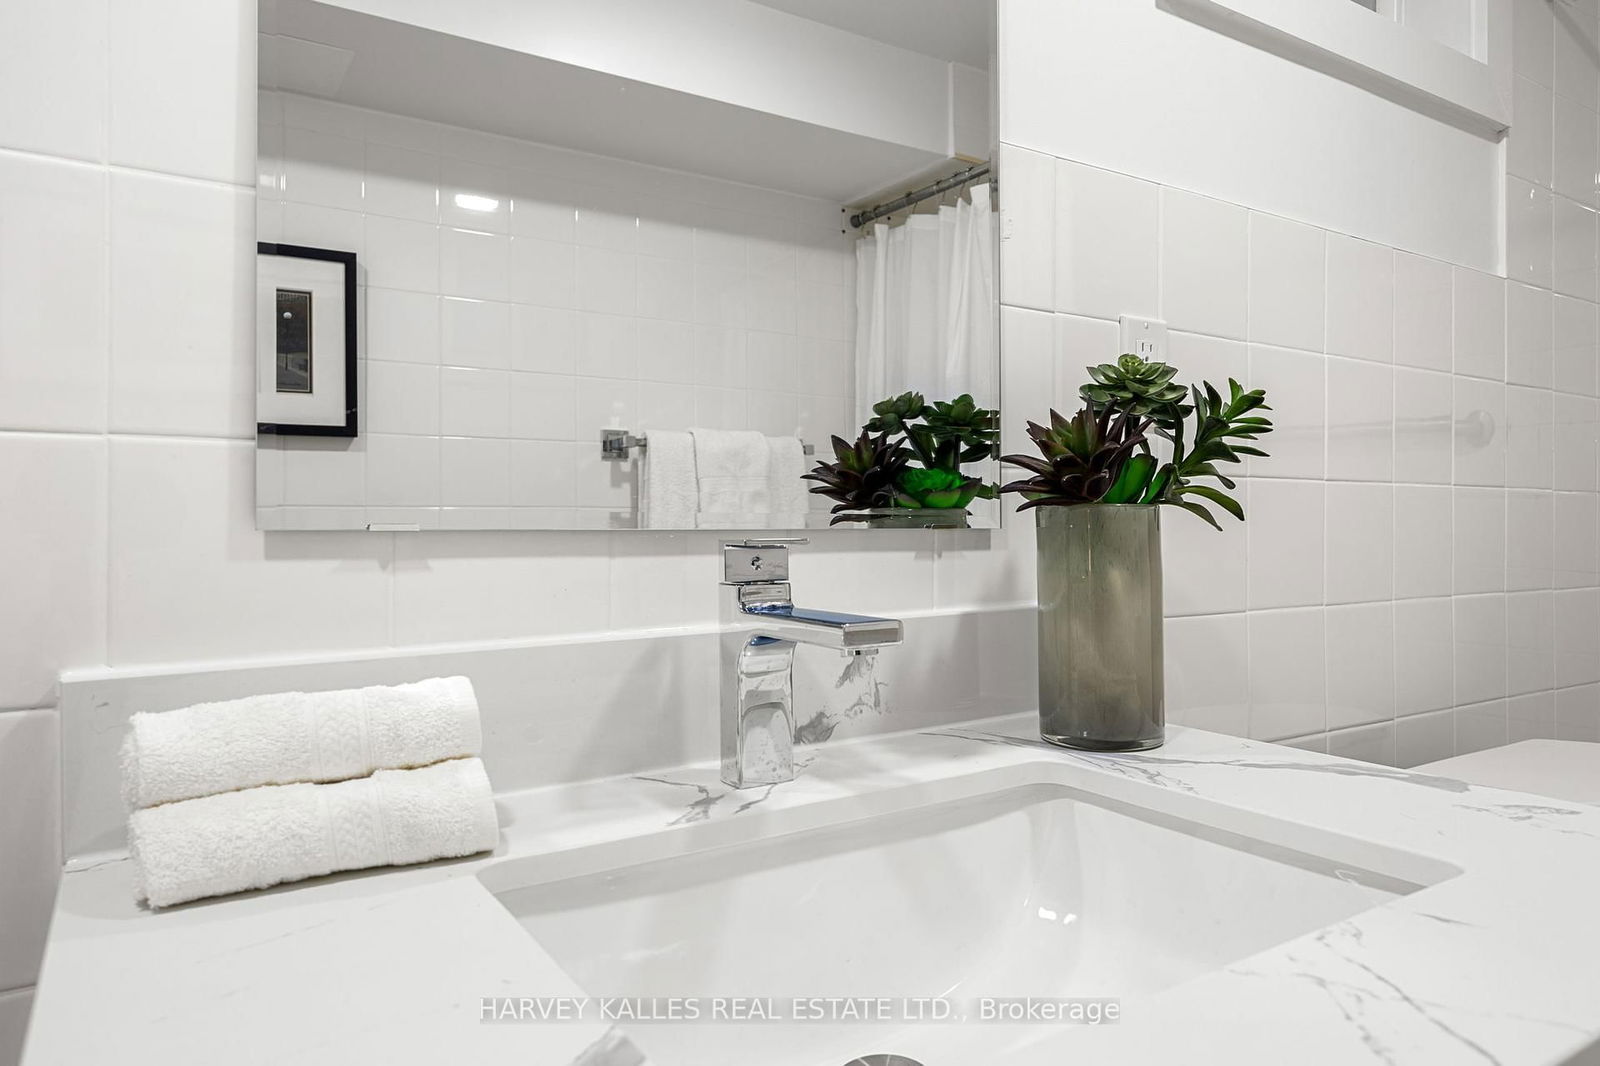
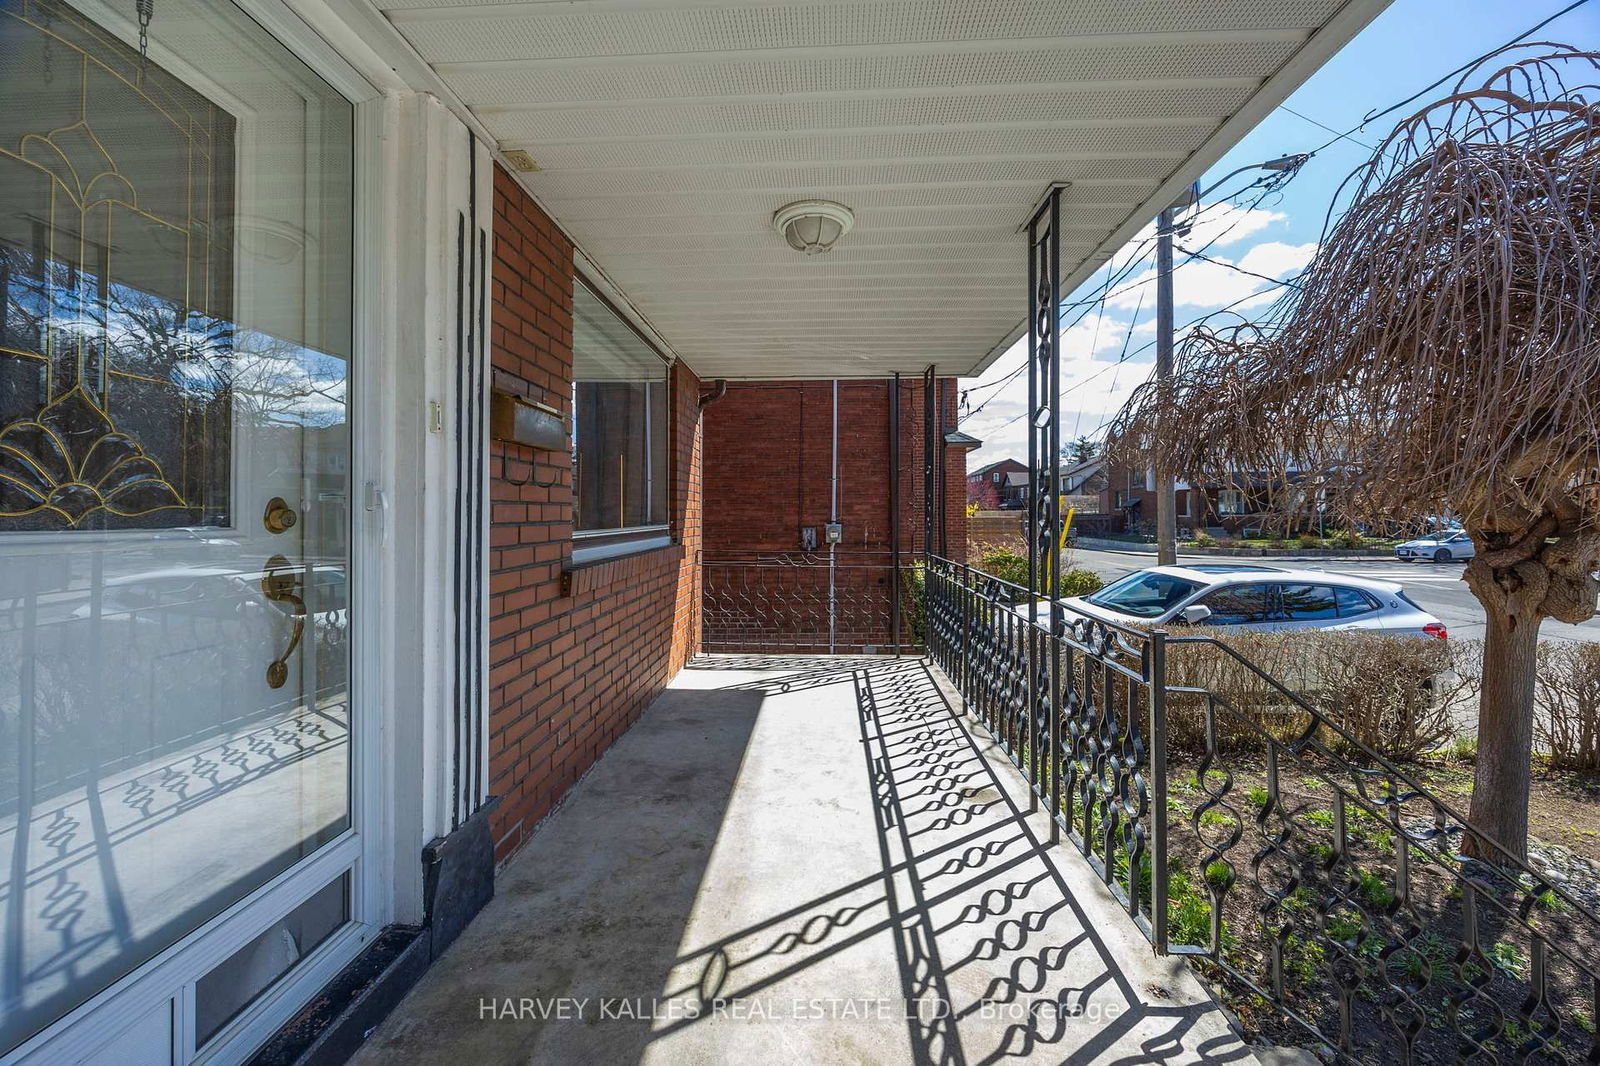
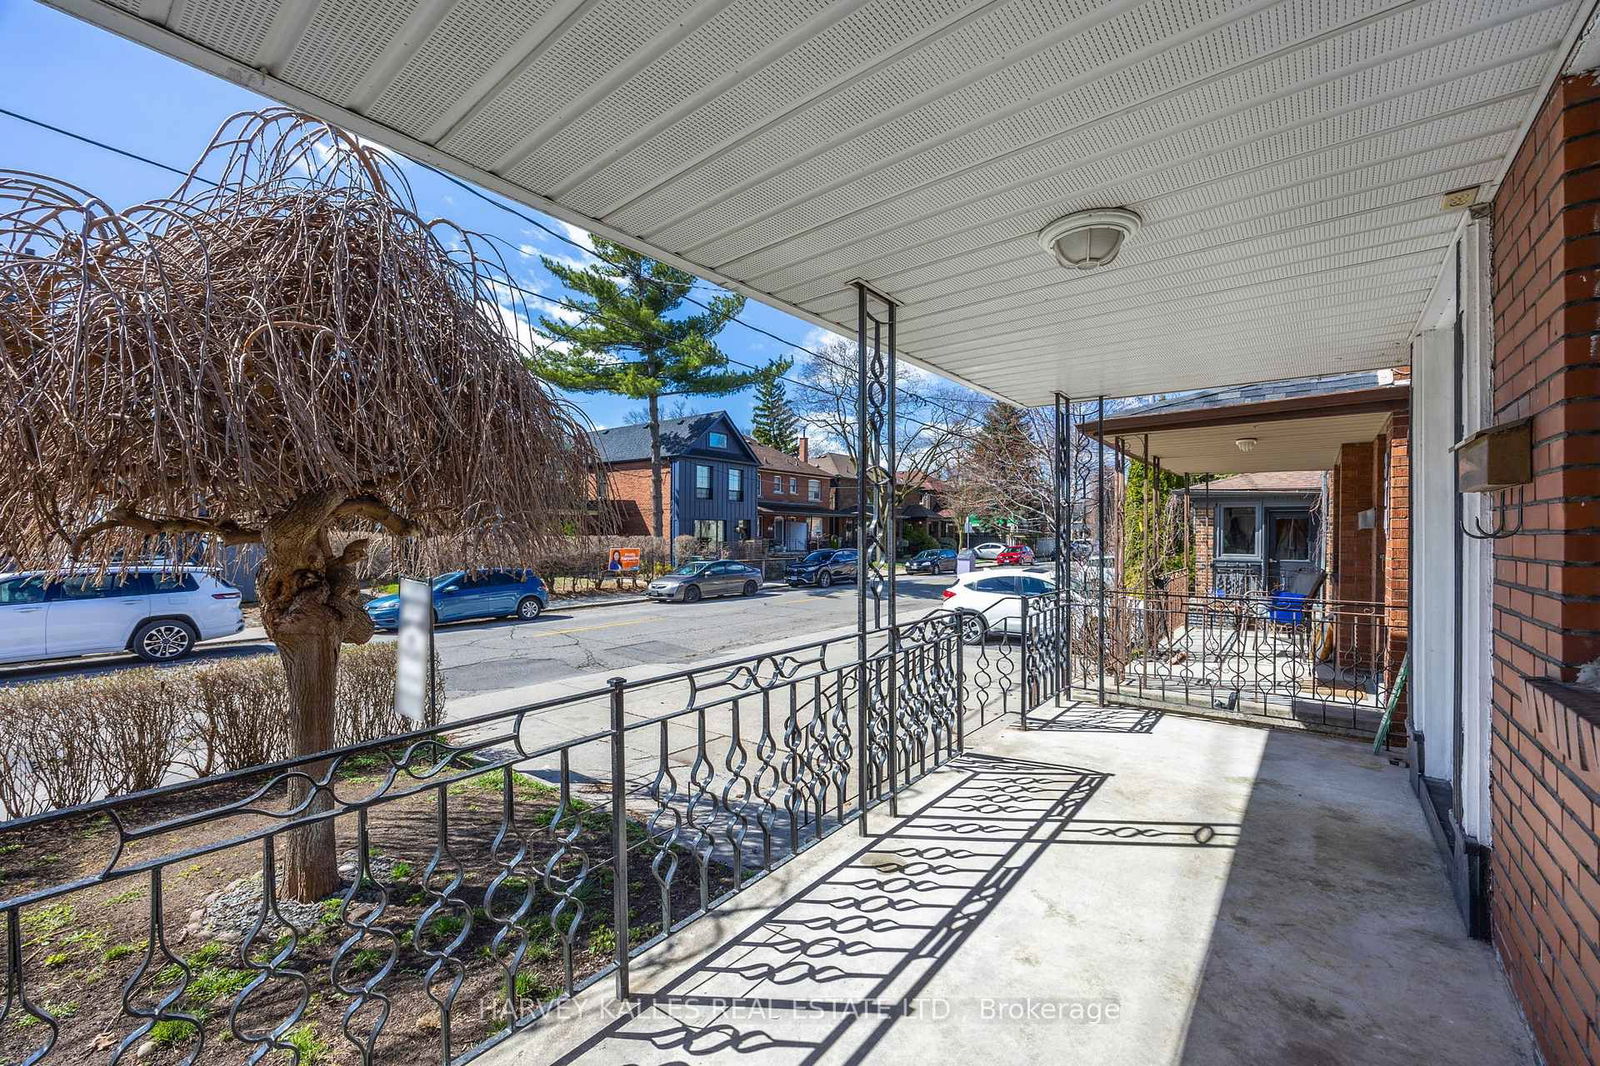
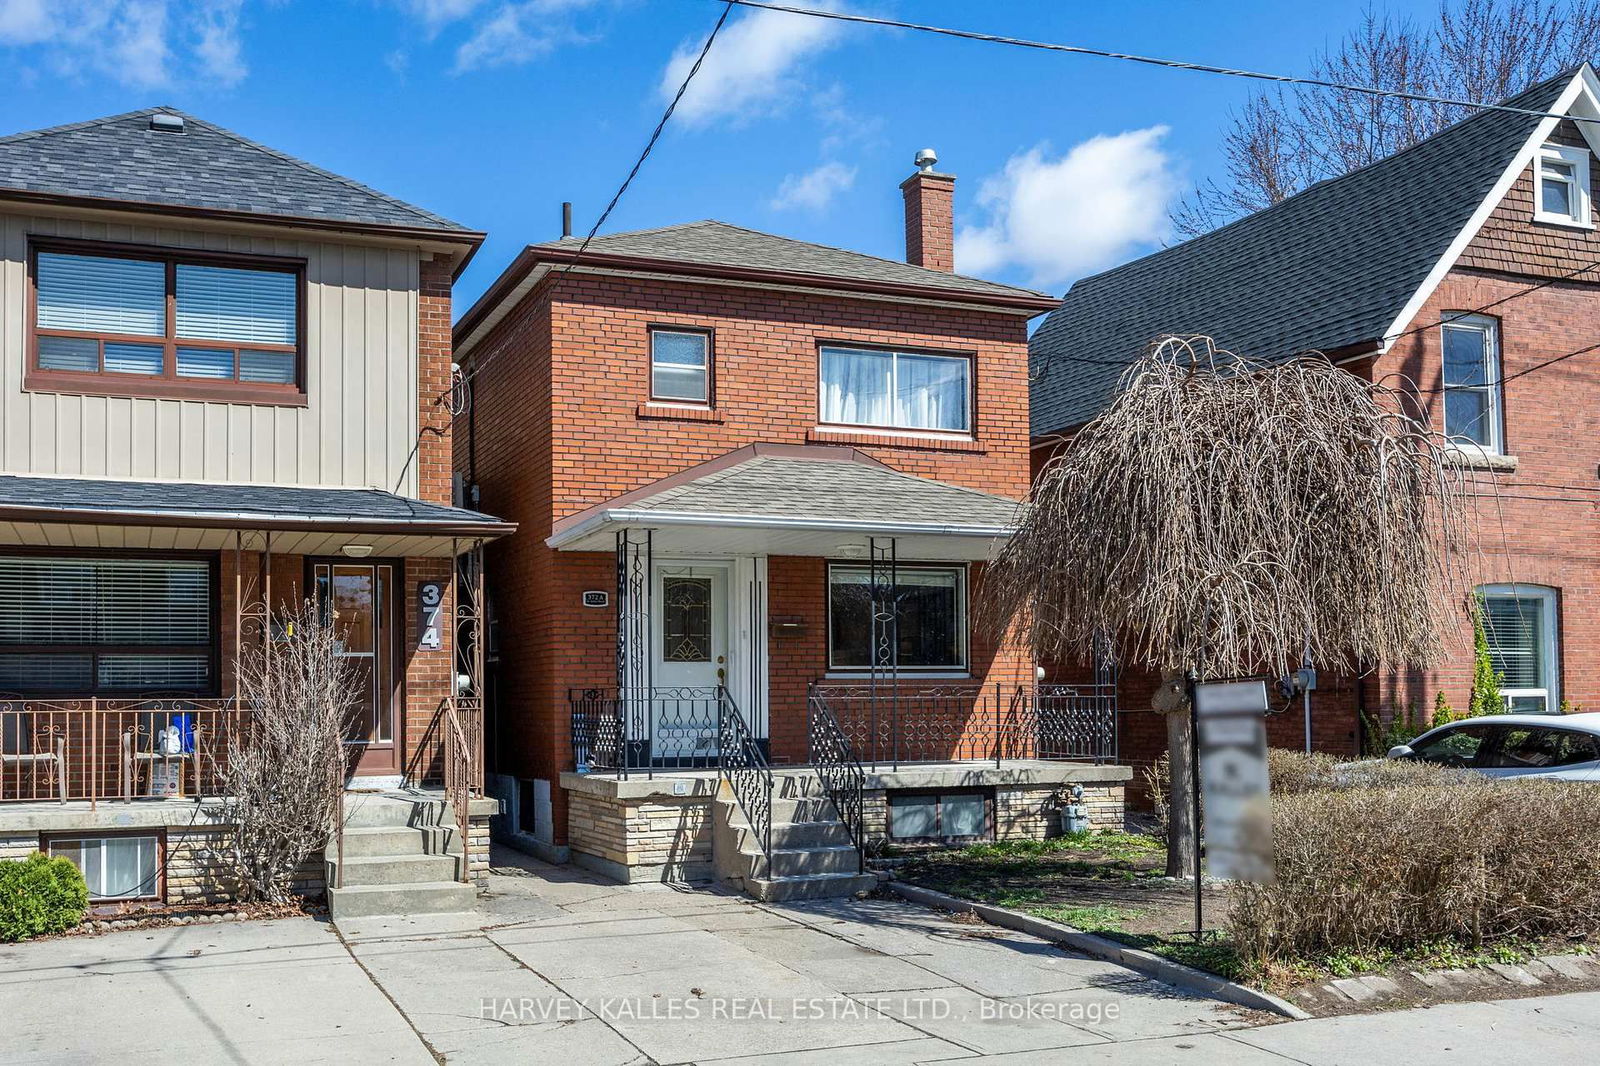
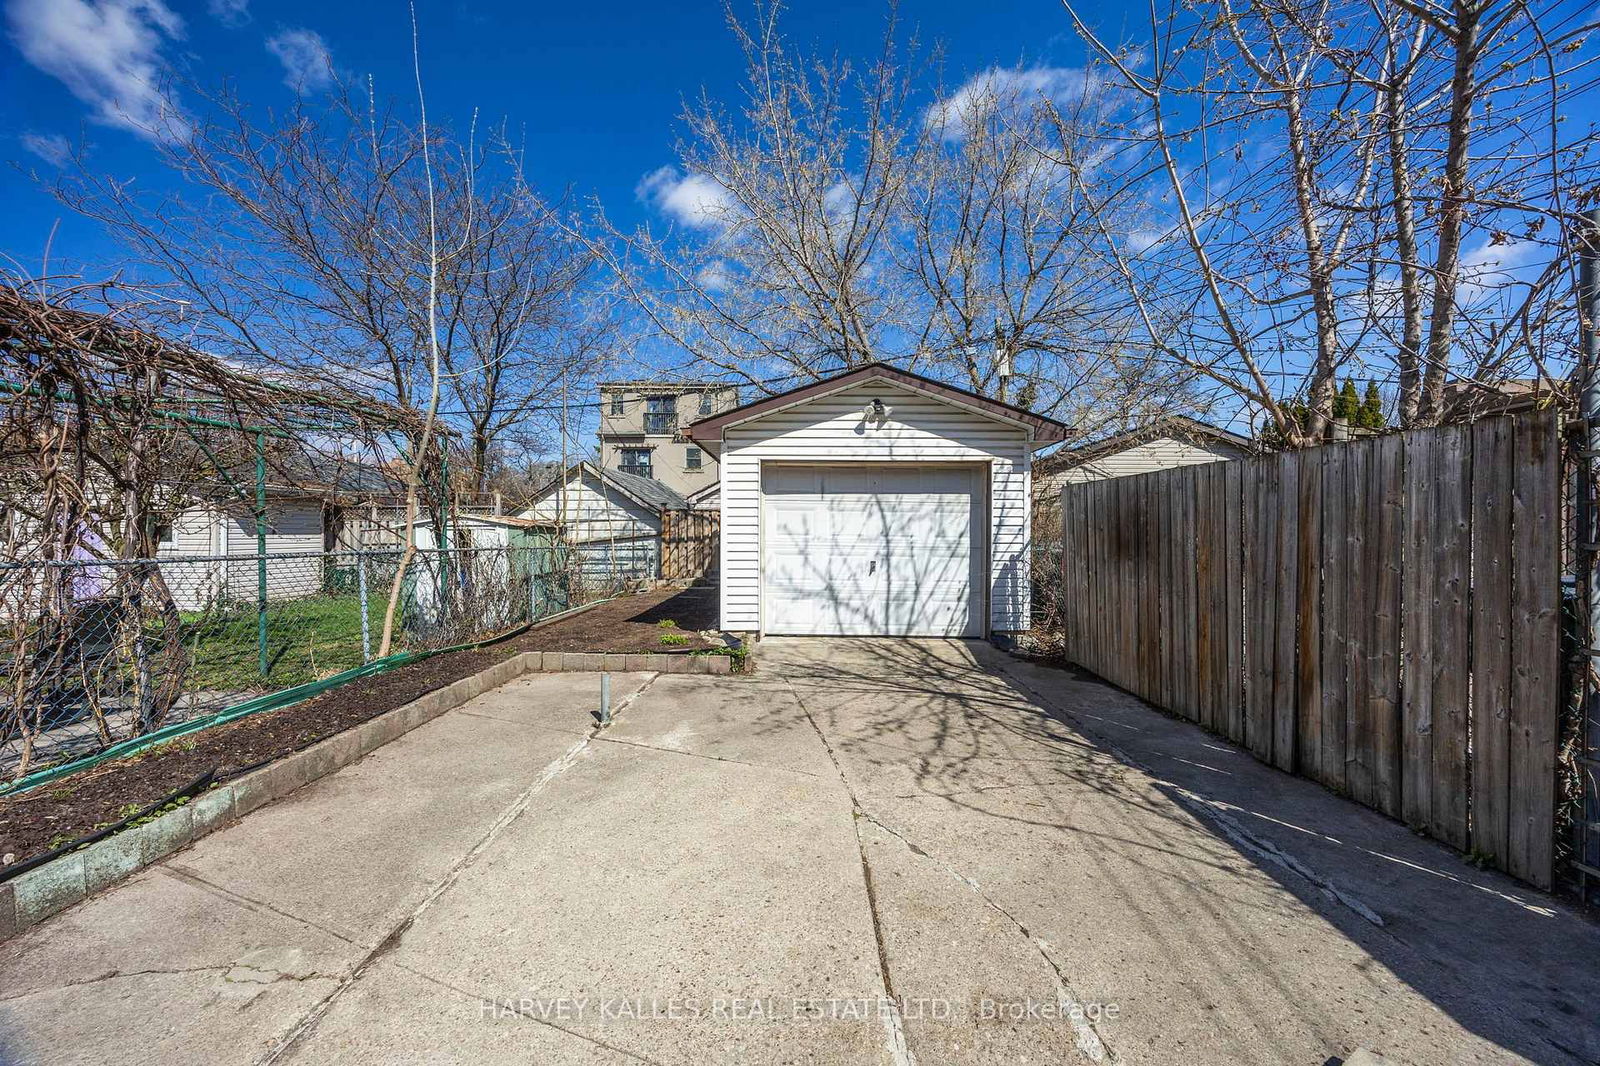
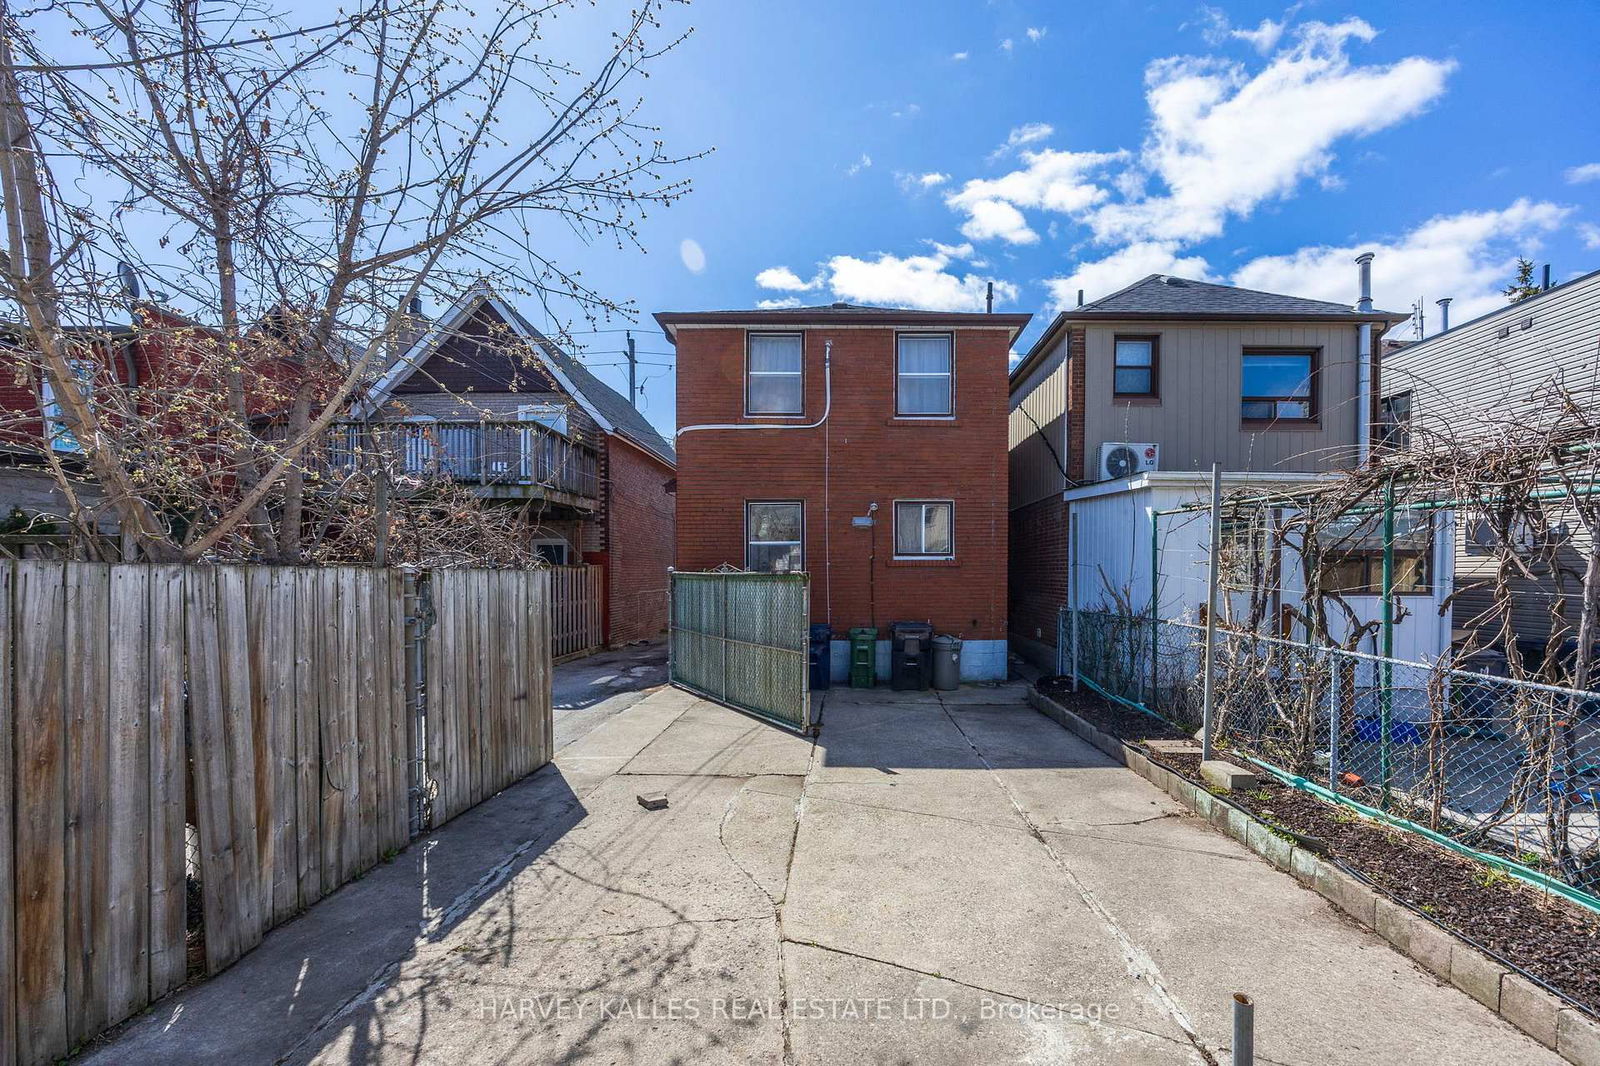
Welcome To This Immaculately Maintained Three Bedroom Detached Home, Perfectly Situated In One Of Toronto's Most Sought-After Neighbourhoods-Bloor West Village. Move-In Ready & Full Of Charm, This Home Combines Classic Character With Thoughtful Modern Updates Throughout. Step Inside To A Bright & Spacious Layout Featuring A Large Living Room, Separate Dining Area, & A Family-Sized Kitchen-Ideal For Busy Weekday Mornings Or Relaxed Weekend Brunches. Every Room Is Equipped With Brand New A/C units For Year-Round Comfort. Upstairs, You'll Find Generously Sized Bedrooms, Including A Sun-Filled Primary Suite With His & Hers Closets. The Fully Finished Basement, With A Separate Side Entrance, Offers Flexible Space For A Recreational Room, Guest Suite, Or Home Office. Outside, Enjoy The Benefits Of A Detached Working Mans Garage, A Mutual Driveway & A Legal Front Parking Pad-A Rare & Valuable Find In The City. Just Steps From Top-Rated Schools, Beautiful Parks, TTC Access, & The Shops, Bakeries, & Cafes That Make Bloor West Village One Of Toronto's Most Beloved Communities, This Home Offers Not Just A Place To Live, But A True Lifestyle Upgrade. Fall In Love. Move Right In. Welcome Home. Entire House Has Been Freshly Repainted (2025). Brand New Kitchen (2025). Virtual Tour & Floor Plans Attached. Legal Front Parking Pad! Fridge, Stove, Washer, Dryer, All Elf's, All Window Coverings. Breakers & Cold Room.
Fridge, Stove, Washer, Dryer, All Elf's, All Window Coverings. Breakers & Cold Room. Entire House Has Been Freshly Repainted (2025). Brand New Kitchen (2025). Virtual Tour & Floor Plans Attached. Legal Front Parking Pad!
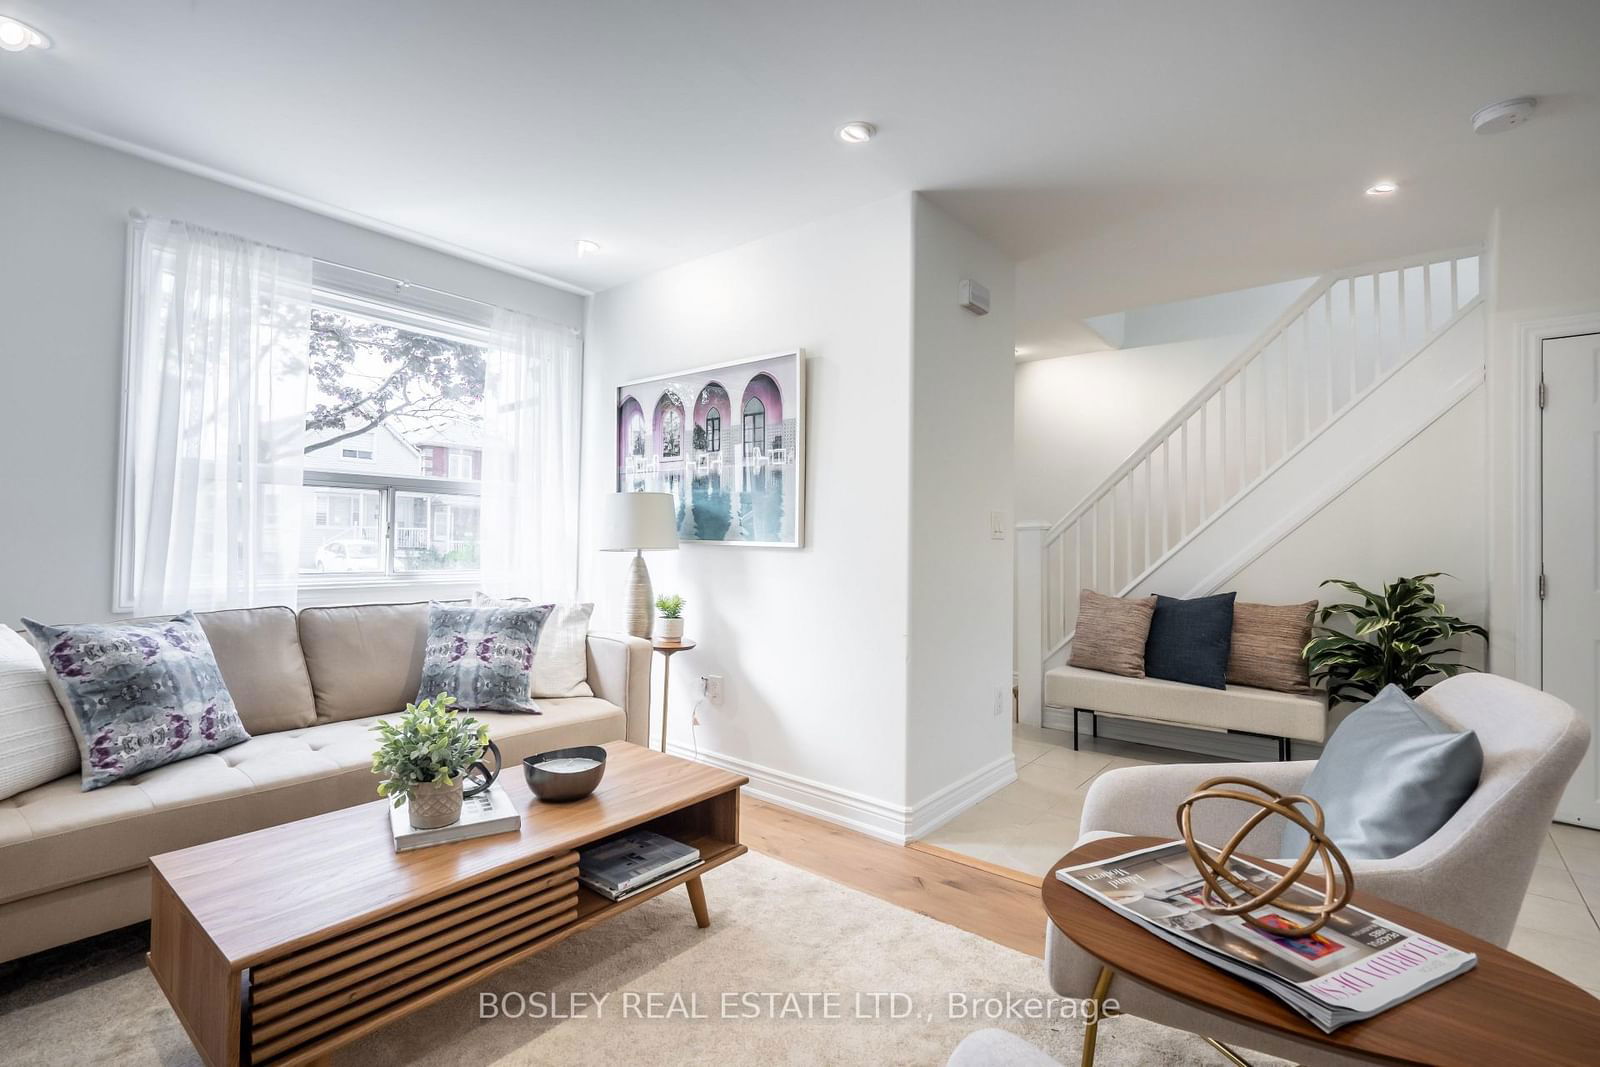
Living
Dining
Kitchen
Primary
2nd Br
3rd Br
Rec
Br
The graph below compares the average list price and average sale price of homes in this neighborhood by month for the last 24 months. When average sale price is greater than average list price, this may suggest a buyer's market. When average sale price is lower than the average list price this may suggest a seller's market.
The graph below illustrates the average days on market for homes in this neighborhood. The yellow area may indicate a buyer's market, the green area may indicate a balanced market and the red area may indicate a seller's market.
Sales Representative, Century 21 People’s Choice Realty Inc., Brokerage
(647) 576 - 2100
Toronto, Runnymede-Bloor West Village, M6S 4A3
Toronto, Corso Italia-Davenport, M6E 4W2